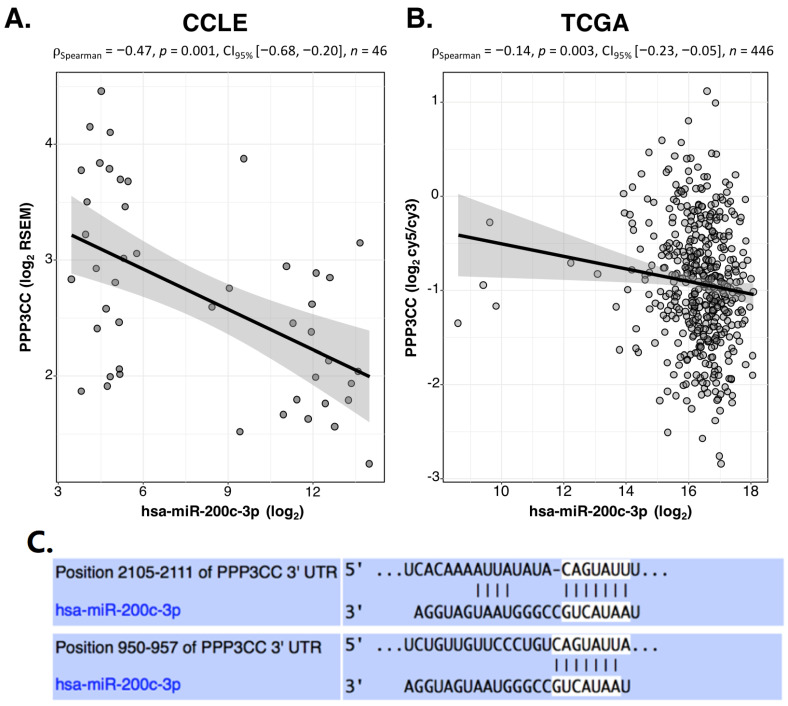
Figure 1.
Inverse correlation between miR-200c-3p and PPP3CC through in silico analysis. (A). Correlation analysis between miR-200c-3p and PPP3CC in n = 46 OC cell lines, based on expression data from CCLE database. Spearman’s rank correlation coefficient was equal to −0.47 with p-value 0.001 (B). Correlation analysis between miR-200c-3p and PPP3CC in 446 EOC patients, based on expression data from TCGA. Spearman’s rank correlation coefficient was equal to −0.14 with p-value 0.003. Data R package ggstatsplot (v. 0.7.2) was used to visualize the correlation analyses. (C). TargetScan algorithm was interrogated for miR-200c-3p binding sites to the 3′UTR of PPP3CC. Two binding sites for miR-200c-3p were identified at two different positions of the 3′UTR: at 2105-2111 nucleotides (nt) and at 950–957nt.

