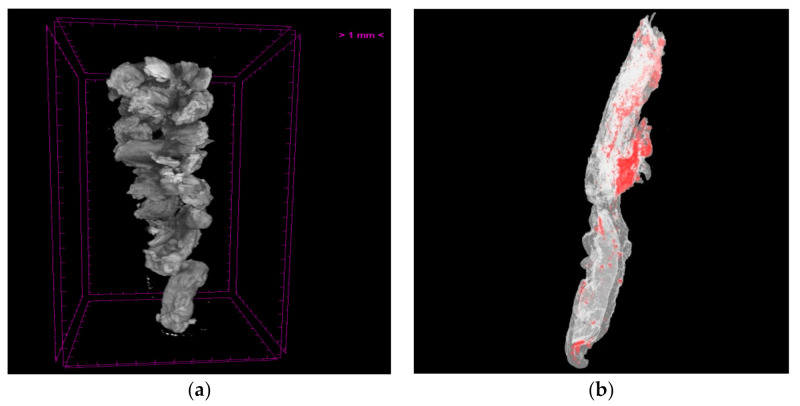
Figure 10.
(a) Volume rendering of thrombi and (b) 3D color visualisation of a thrombus sample (volume 16 mm3) acquired through the Skyscan 1172 micro-CT scanner: Erythrocyte-rich regions were rendered in red, whereas platelet-rich regions were rendered in white. (b) from [13], reproduced under a CC-BY licence.

