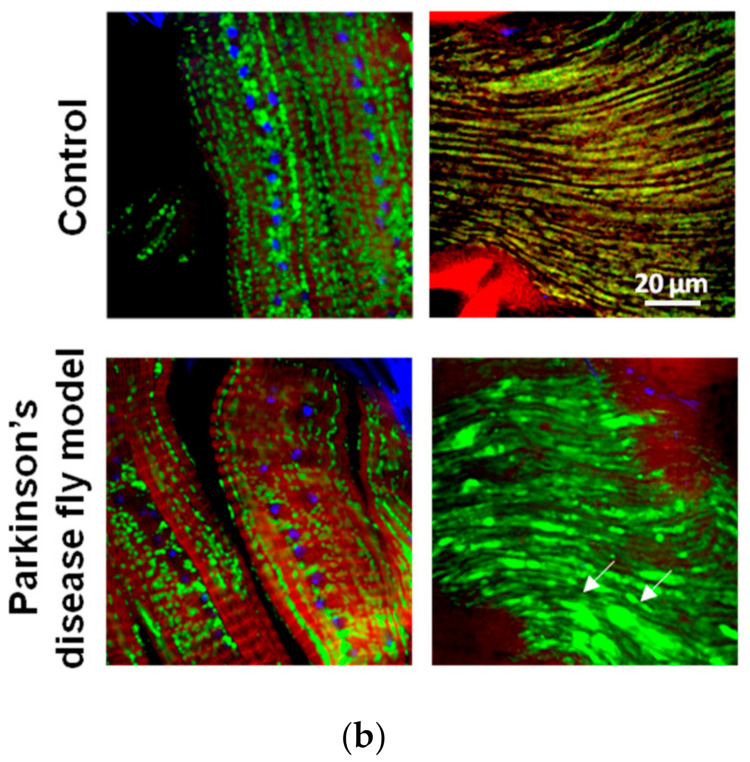
Figure 13.
CLSM visualisation (×60 magnification) of different stained Drosophila melanogaster tissues. (a) Drosophila heart tissue following immunofluorescence staining with an antibody against the Atg8a/GABARAP autophagic protein. (b) Different sections of a fly muscle probed with the mitochondrial marker blw/ATP5A (green) in a Parkinson’s disease fly model, showing accumulation of mitochondrial aggregates (arrows) vs. control. In (a,b) nuclei and actin were counterstained with DAPI and phalloidin, respectively. In (a), Z-stacks with a step size of 1 µm were taken using identical settings, and each stack consisted of 26 plane images.


