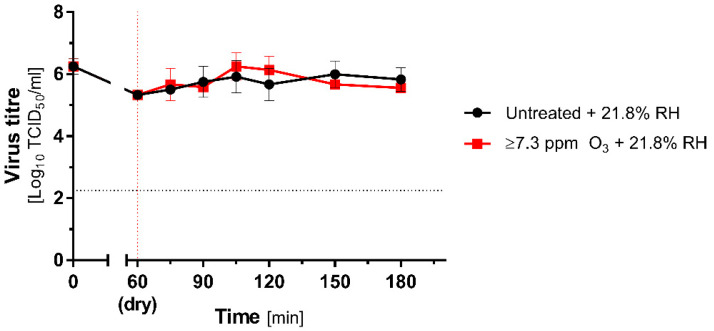
Figure 3.
Inactivation of the coronavirus during the ozone treatment under low RH (21.8% RH). Comparison of mean (±SD, n = 3) titres of MHV recovered from contaminated carriers subjected to ozone treatment (≥7.3 ppm; red lines) and untreated (black lines) at 21.8% RH. Black dotted line represents the 4 logs virucidal efficiency threshold with respect to the initial titre; the red dotted line represents the beginning of O3 treatment.

