Figure 2.
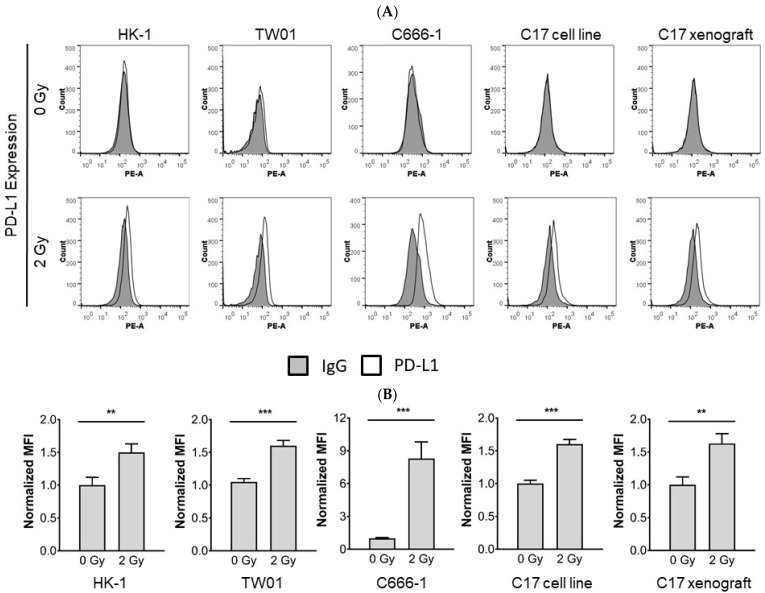
Radiotherapy induces surface expression of PD-L1 in NPC cells. PD-L1 surface expression was measured by flow cytometry 24 h after radiation of NPC cells with 2 Gy. (A) Histogram plots of PD-L1 expression on NPC cells; (B) Quantification of PD-L1 expression on NPC cells. Quantitative data of three independent experiments is shown as normalized mean fluorescence intensity (MFI). Normalized MFI is calculated by dividing the MFI of the anti-PD-L1 antibody-stained sample by the MFI of the control antibody. Data is shown as mean ± S.E.M. Asterisks indicate statistically significant differences between all cell lines (one-way ANOVA; ** p < 0.01; *** p < 0.001).

