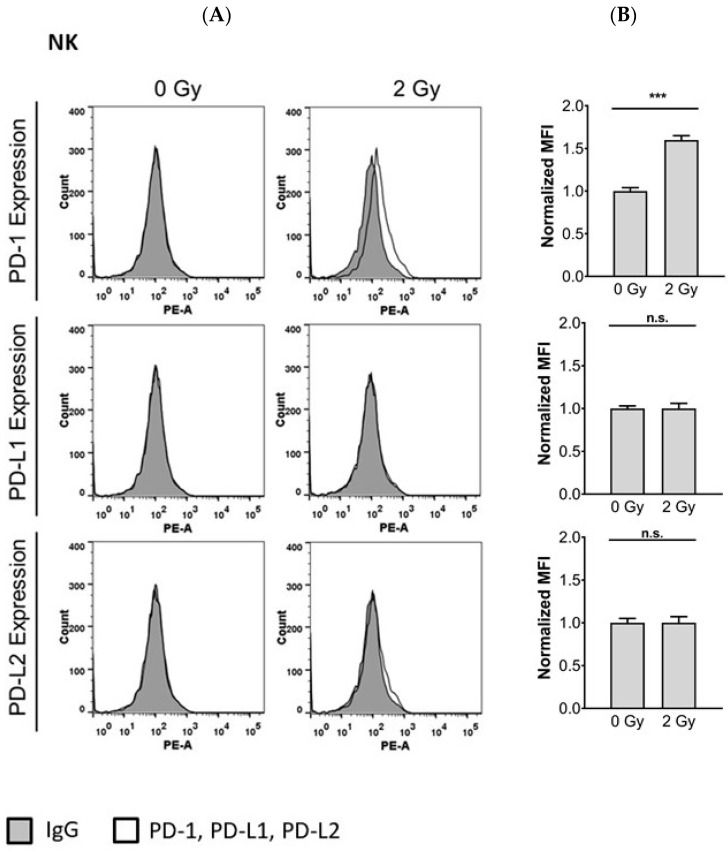
Figure 4.
Radiotherapy upregulates surface expression of PD-1 in NK cells. Cells were irradiated with 2 Gy. After 24 h PD-1, PD-L1, and PD-L2 expression was analyzed by flow cytometry. (A) Histogram plots of PD-1, PD-L1 and PD-L2 expression on NK cells; (B) quantification of PD-1, PD-L1 and PD-L2 expression on NK cells. Quantitative data of three independent experiments are shown as normalized mean fluorescence intensity (MFI). Data of normalized MFI is calculated by dividing the MFI of the sample stained by the antibody of interest by the MFI of the control antibody. Data is shown as mean ± S.E.M. Asterisks indicate statistically significant differences between all cell lines (one-way ANOVA; *** p < 0.001; n.s.: not significant).

