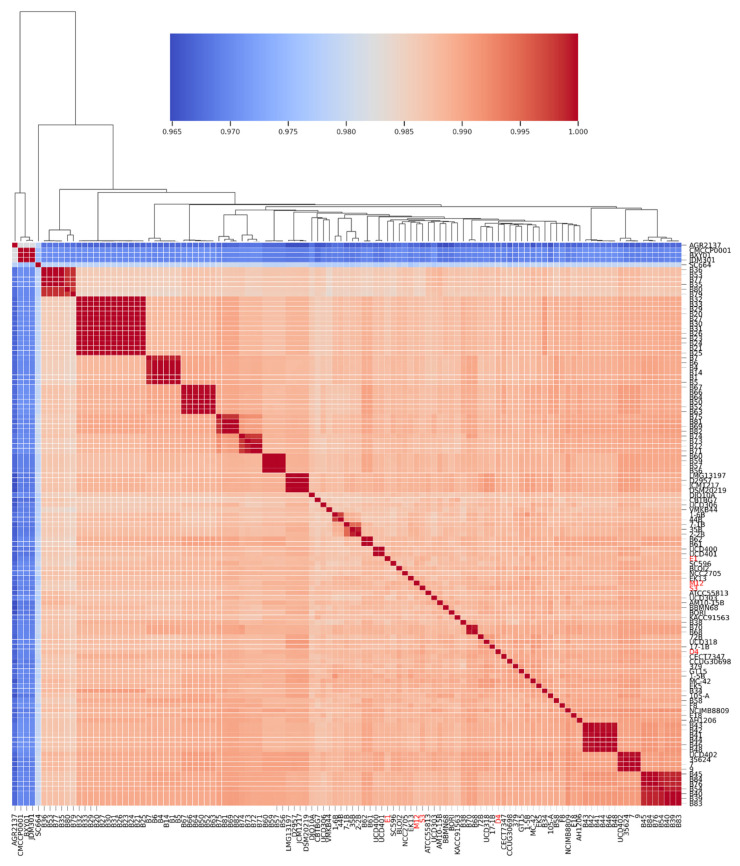
Figure 2.
Heatmap representing the percentage of average nucleotide identity (ANI) of 158 B. longum subsp. longum strains. The color key represents the percentage identity among strains with lower (blue) and higher (red) ANI values. The strains are clustered in dendrograms based on row means. The Chilean strains are colored in red.

