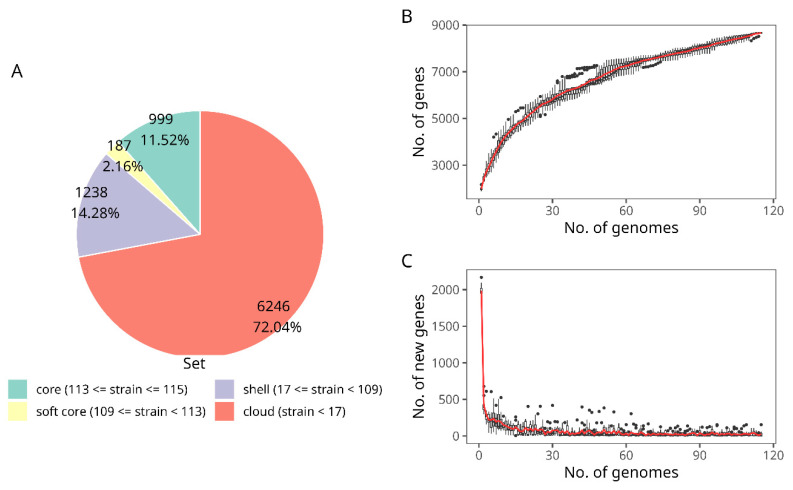
Figure 3.
Pangenome of B. longum subsp. longum strains. (A) Pie chart indicating the gene set in the pangenome. (B) Plot of the accumulate number of new genes against the number of genomes added in the pangenome. (C) Number of genes attributed to the core genome versus the number of genomes added in the core genome plot.

