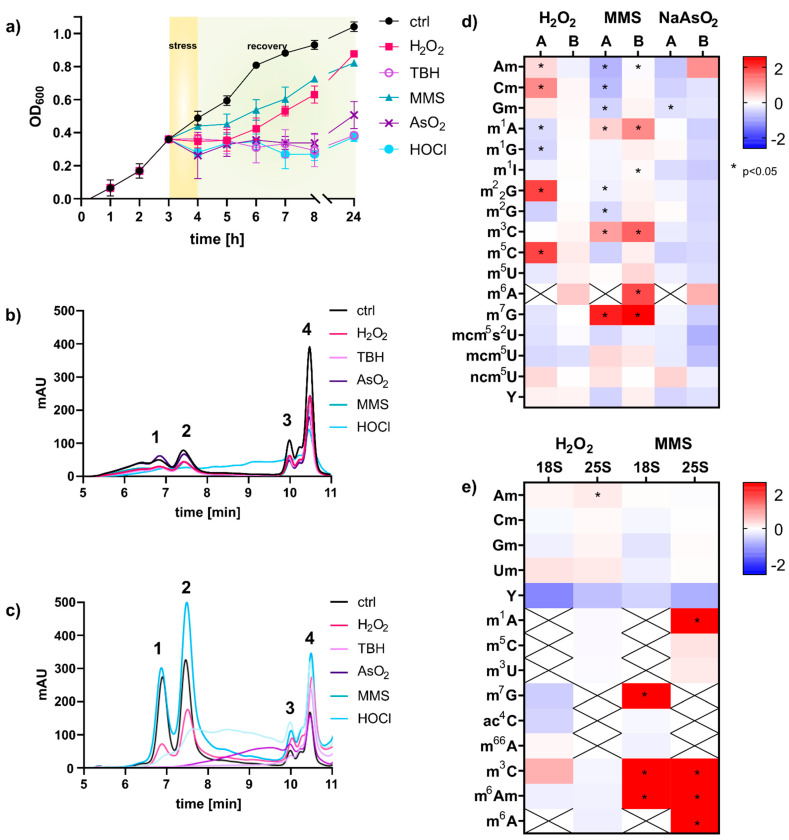
Figure 1.
Analysis of total RNA and RNA modification changes upon chemical stress exposure of S. cerevisiae cultures. (a) Logarithmic growth curve in YNB medium using LD50 concentrations of stressors: H2O2 (2 mM), NaAsO2 (40 mM), HOCl (3 mM), MMS (12 mM), TBH (10 mM). (b) Total RNA of S. cerevisiae isolated with TRI reagent or hot phenol (c) assessed with size exclusion chromatography, 1: 25S, 2: 18S, 3: 5.8S rRNA, 4: tRNA (d) Fold changes in modification density in small RNA < 200 nts: (A) Chan et al. and (B) total tRNA from this work. An increase is shown in red and a decrease in blue. Student’s t-test results: p < 0.05 indicated with *. (e) Fold changes in modification density in 18S and 25S rRNA; Student’s t-test results: p < 0.05 indicated with *. All experiments were done in biological triplicates; error bars reflect standard deviations.

