Figure 2.
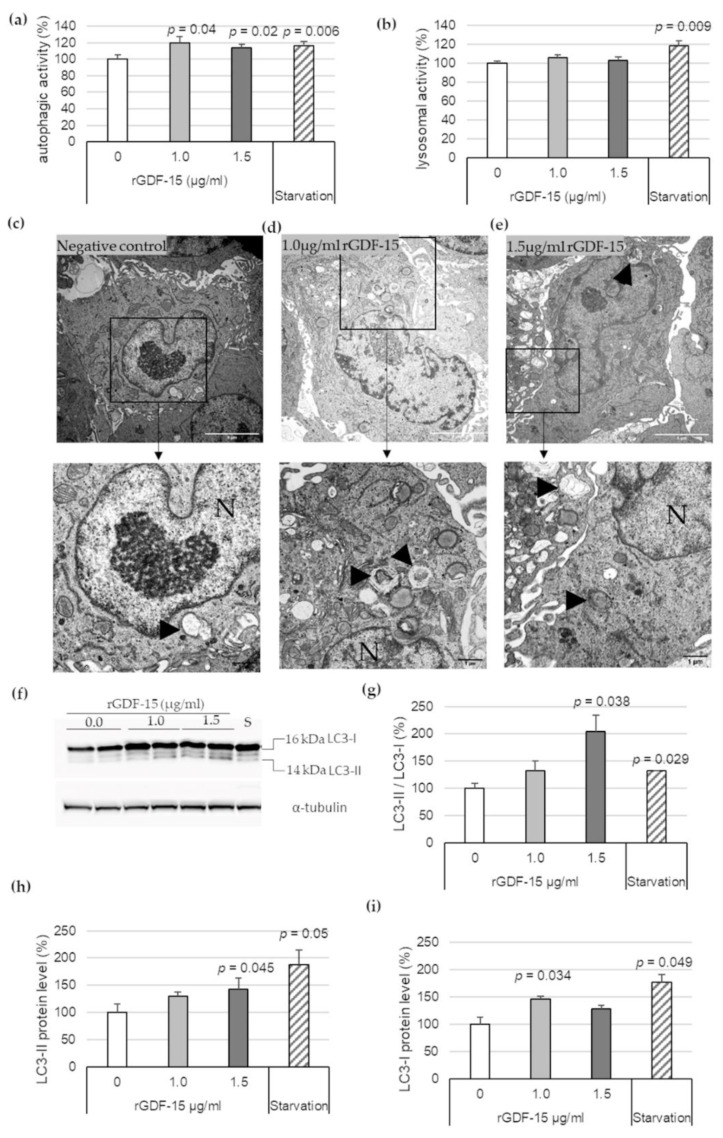
Autophagic and lysosomal activities in rGDF-15-treated human THP-1 MΦ. (a) Autophagic activity (%) in rGDF-15-treated human THP-1 MΦ were determined using fluorescent Cell Meter™ Autophagy Assay Kit [OD333/518]; (b) Lysosomal activity (%) in human THP-1 MΦ in rGDF-15-treated human THP-1 MΦ were determined using LysoBrite™ Red [OD575/597]. Data are presented as mean + SEM. medium alone = 100%; (c–e) TEM of human THP-1 MΦ. N, nucleus; Black arrowhead autophagic vacuoles/autolysosomes. White scale bars: 5 µm; black scale bars: 1 µm. (f) Representative images of Western blot results for LC3-I, LC3-II and α-tubulin. S = starvation (g–i) percentage of (g) LC3-II/LC3-I ratio, (h) LC3-II and (i) LC3-I protein levels in THP-1 MΦ. Expression was normalized against α-tubulin and quantified by ImageJ. Data are presented as mean + SEM (four independent experiments were performed). 0 µg/mL rGDF-15 = 100%.

