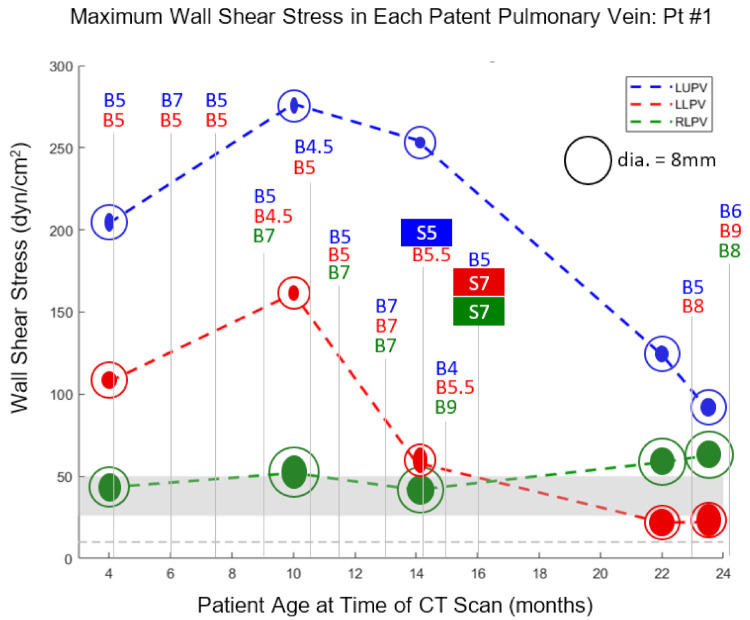
Figure 1.
For Pt1, maximum WSS in the LUPV, LLPV, and RLPV is plotted versus patient age at the time of each CT scan. The marker for each plotted point consists of a solid ellipse, whose major and minor diameters correspond to those of the vein as measured by CT, along with a circle with diameter corresponding to the target lumen size required to achieve a WSS of 10 dyn/cm2. Each balloon dilation (B) is labeled at the appropriate point on the timeline along with the maximum balloon diameter (mm) that was achieved. Stent (S) implantation is similarly labeled along with stent diameter in mm. The gray horizontal bar indicates the WSS range between 26 and 50 dyn/cm2 at which neointimal hyperplasia has been reported to develop in large veins. The gray horizontal dotted line indicates a WSS level of 10 dyn/cm2, taken as the upper limit of normal.

