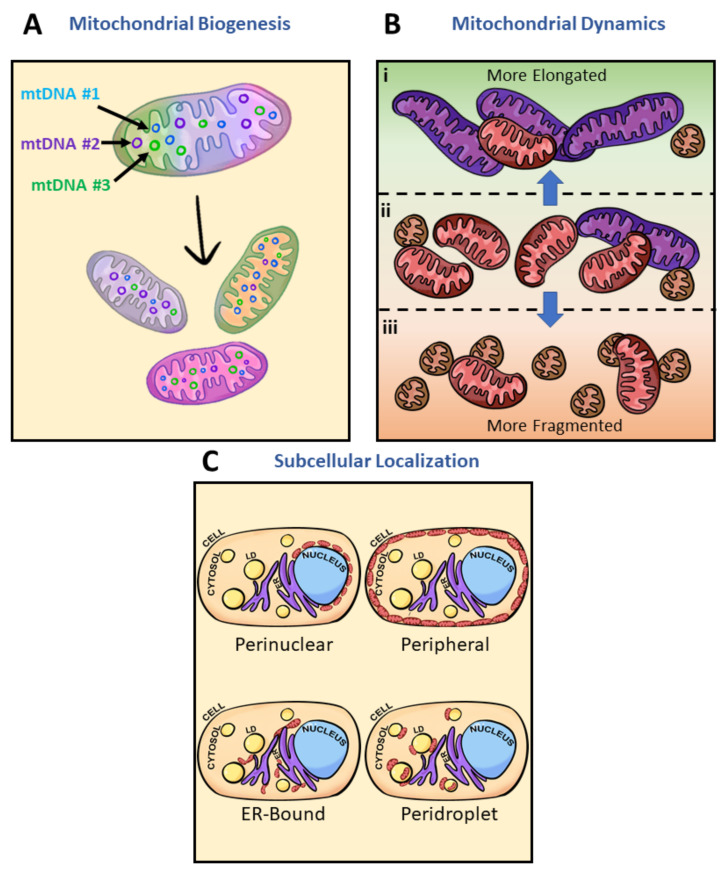
Figure 4.
Inducers of mitochondrial heterogeneity. Potential sources of mitochondrial heterogeneity include mitochondrial biogenesis, architectural adaptation, and subcellular localization. (A) Mitochondrial biogenesis produces new mitochondria from preexisting ones (tricolor mitochondria); mitochondria which may have mtDNA sequence variation, and can induce variation in mitochondrial protein content or expression. Variations in mtDNA and copy number are represented by the circles of various colors within the mitochondria. Every single color (purple, blue, and green) depicted represents one version of mtDNA or expression pattern. As new mitochondria are made, the content within the new mitochondria will often not be perfect copies of the original mitochondria. Each different daughter mitochondria are of a different singular color to emphasize the dominance of one mtDNA. (B) Mitochondrial architectural adaptation often occurs in response to changes in environmental factors such as nutrient levels, oxidative stress, growth hormones, cell signaling, or pathogenicity. Mitochondria at basal state (ii) consist primarily of intermediate-sized mitochondria (red). The highly dynamic organelle has been observed to (i) elongate (purple) much of its population under starvation and (iii) fragment (orange) under nutrient excess. Adaptive mechanisms leading to changes in mitochondrial architecture thereby induce heterogeneity. (C) Mitochondrial localization within a single cell and unique traits associated with those regions represent another way heterogeneity is present in physiological states. Mitochondrial heterogeneity and metabolic flexibility are a product of the dramatic differences in mitochondrial phenotypes due to their cellular positions. Perinuclear mitochondria localize near the nucleus, peripheral mitochondria border the plasma membrane, ER-bound mitochondria are tethered to the ER, and peridroplet mitochondria are attached to lipid droplets. Diagram of a typical cell containing nuclei (blue), lipid droplets (LD) (yellow), endoplasmic reticulum (ER) (purple), cytoplasm (peach), and mitochondria (red ovals). For further discussion, see Figure 3.

