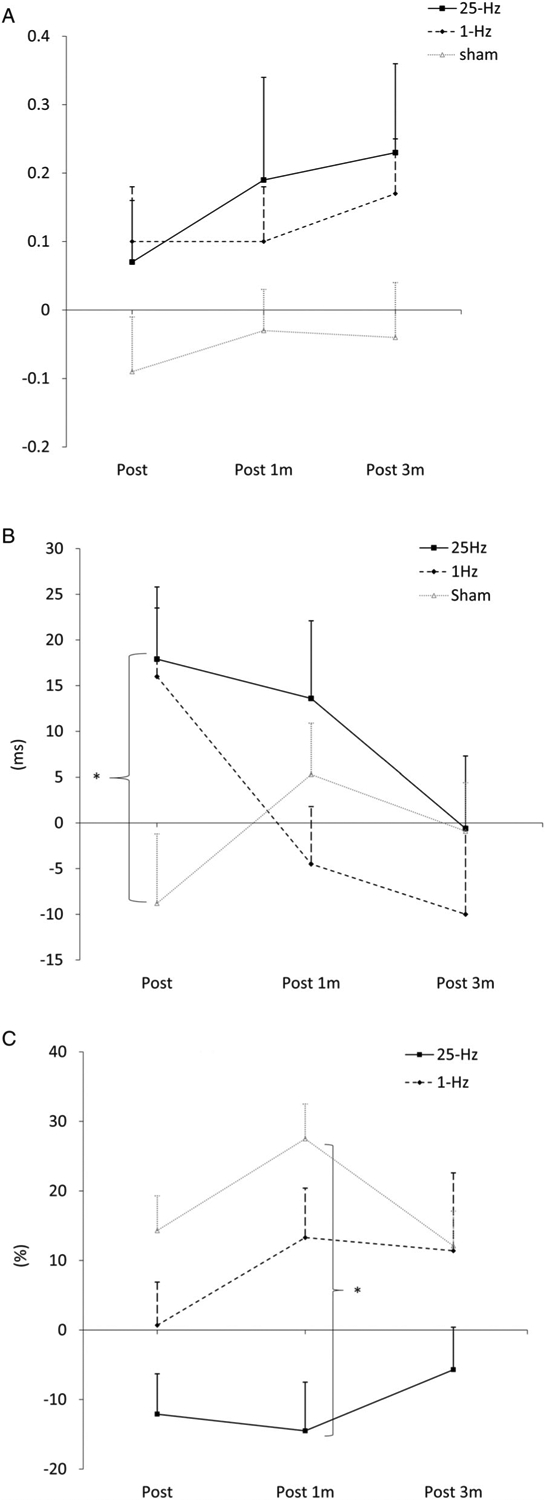
FIGURE 3:

(A) Change in slope of recruitment curve. (B) Change in cortical silent period. (C) Change in short-interval intracortical inhibition. Post = 1 day postintervention; Post 1m = 1 month postintervention; Post 3m = 3 months postintervention. * denotes p < 0.05.
