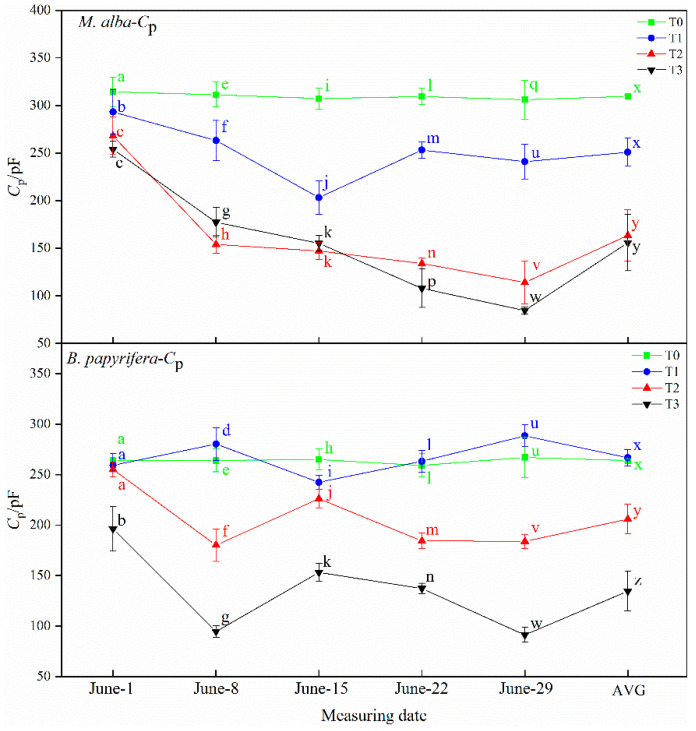
Figure 6.
The physiological capacitance (Cp) of the leaves of M. alba and B. papyrifera under different water stress levels. Note: Values are the means ± SE of 15 replicates. Different letters indicate significant differences at T0-T3 levels in each measurement. Bars with different letters are significantly different at p ≤ 0.05 (Tukey). AVG is the mean value of five measured data. M. alba-Cp: The physiological capacitance of the leaves of M. alba. B. papyrifera-Cp: The physiological capacitance of the leaves of B. papyrifera. T0 is the control group, T1 is the mild drought, T2 is the moderate drought, T3 is the severe drought.

