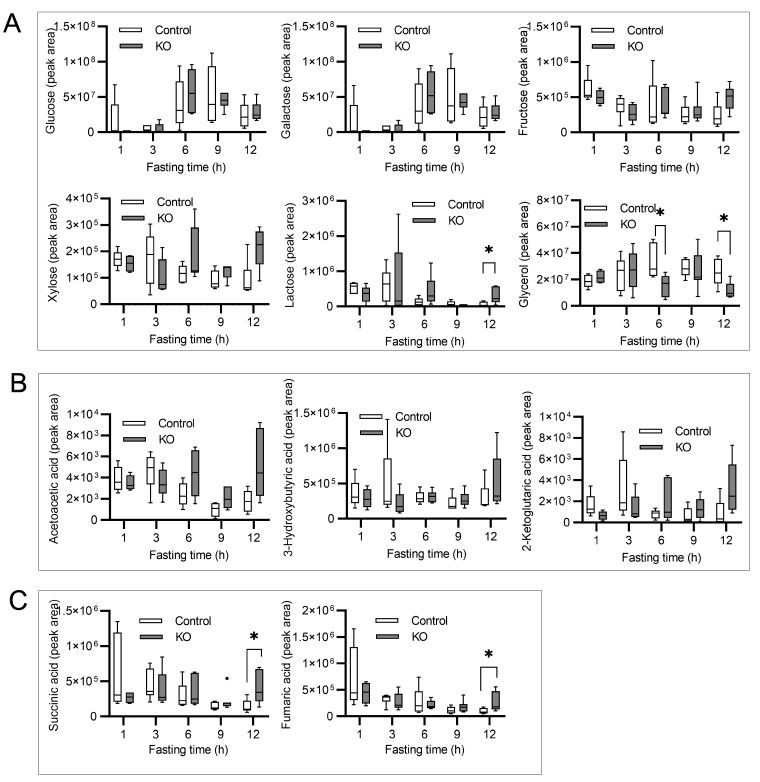
Figure 3.
The gas chromatography-tandem mass spectrometry analysis of metabolites in the serum of starved neonatal mice. The numbers of mice (starvation time) were as follows: 5 (1 h), 6 (3 h), 5 (6 h), 6 (9 h), and 6 (12 h) Control mice and 4 (1 h), 5 (3 h), 7 (6 h), 7 (9 h), and 5 (12 h) KO mice. The metabolite concentrations were measured as the peak area of the calibration curve, and the concentration at each starvation time was compared between the groups. The levels of serum saccharides and glycerol (A), ketone bodies (B), and representative metabolites of the TCA cycle (C) during starvation. Boxes represent the interquartile range (25th to 75th percentiles), and lines within the boxes are the median; error bars represent the 25th percentile minus 1.5 times the interquartile range (IQR) and the 75th percentile plus 1.5 times the IQR. Mann-Whitney U test; * p < 0.05, KO: liver-specific Atg5-deficient.

