Figure 4.
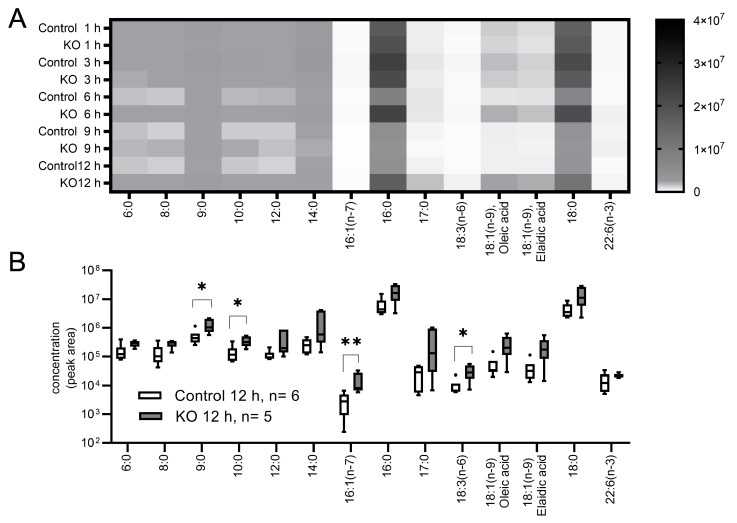
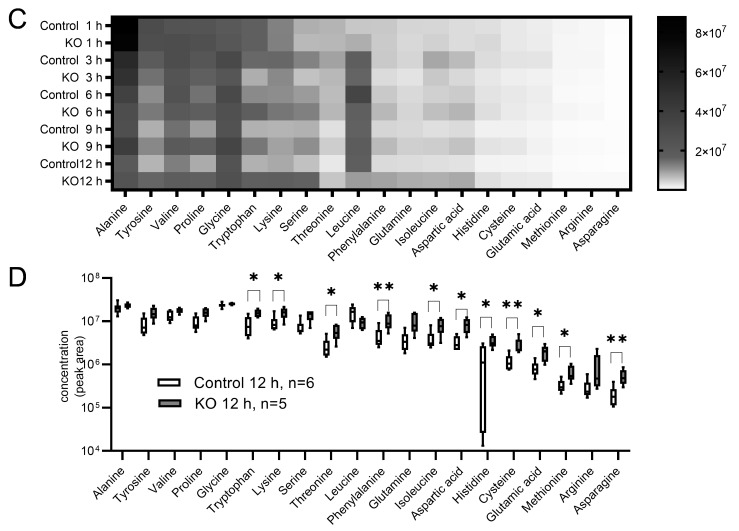
Serum FFA and amino acids concentrations in starved mice according to a gas chromatography-tandem mass spectrometry analysis. The numbers of mice (starvation time) were as follows: 5 (1 h), 6 (3 h), 5 (6 h), 6 (9 h), and 6 (12 h) Control mice and 4 (1 h), 5 (3 h), 7 (6 h), 7 (9 h), and 5 (12 h) KO mice. The metabolite concentrations were measured as the peak area of the calibration curve, and each metabolite after 12-h of starvation was compared between the groups. (A) Heat map of changes in the concentration of 14 FFAs. Higher density matrixes indicate a larger amount of FFAs. (B) FFA concentrations after 12-h of starvation. Boxes represent the interquartile range (25th to 75th percentiles), and lines within the boxes are the median; error bars represent the 25th percentile minus 1.5 times the interquartile range (IQR) and the 75th percentile plus 1.5 times IQR. (C) Heat map of changes in the concentration of 20 amino acids. Higher density matrixes indicate a larger amount of amino acids. (D) Amino acid concentrations after 12-h of starvation. Boxes represent the interquartile range (25th to 75th percentiles), and lines within the boxes are the median; error bars represent the 25th percentile minus 1.5 times the interquartile range (IQR) and the 75th percentile plus 1.5 times IQR. Mann-Whitney U test; * p < 0.05, ** p < 0.01. KO: liver-specific Atg5-deficient.


