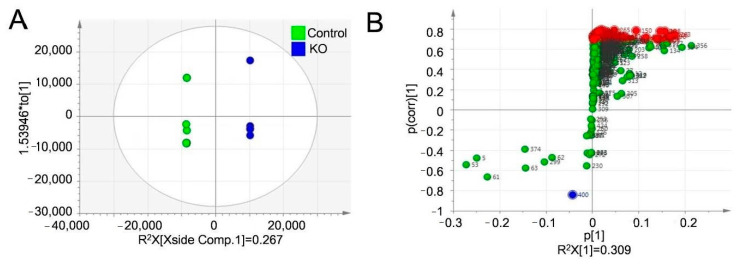
Figure 5.
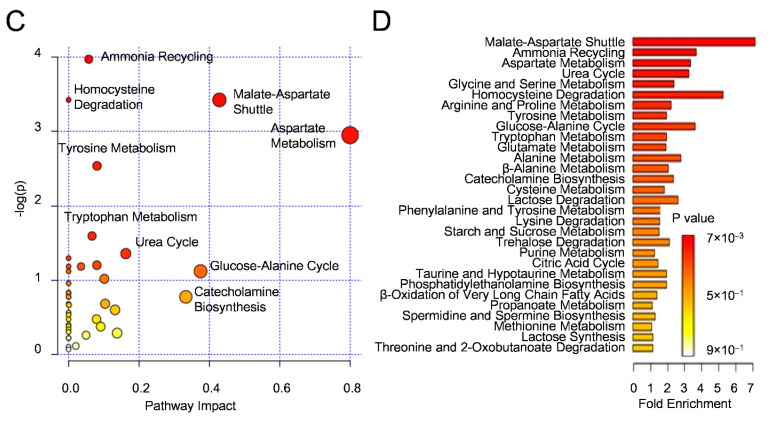
Multivariate statistical and pathway analyses of serum metabolites after 12 h of starvation. (A) The OPLS-DA score scatter plot generated from serum metabolite data of KO and Control mice. The x-axis shows the intra-group variance, and the y-axis shows the inter-group variance. Each point represents the results of an analysis of data from one mouse. A differential metabolic pattern was noted between KO (blue) and Control group (green) by the plots clearly separated on the score scatter plot. (B) S-plot of serum metabolites from KO and Control mice. Each dot indicates individual metabolite. The numbers beside the dots indicate the individual numbers of metabolites. The S-plot visualizes both the covariance (y-axis) and correlation (y-axis, p-value) between the metabolites and the modelled class designation. The 52 significantly altered metabolites with 0.7 < p (corr) <1.0 (red dots) or –1.0 < p (corr) < –0.7 (blue dot) were selected as potential biomarker metabolites (shown in Supplementary Table S2.). (C) A MetPA based on potential biomarker metabolites. The MetPA visualizes the pathway impact (y-axis), p-value (y-axis, colour of the circle), and number of hit metabolites (width of circle). (D) A MSEA based on potential biomarker metabolites. Color intensity (yellow to red) reflects increasing statistical significance MSEA. The lengths of the bars represent the fold enrichment. Six pathways were identified as significantly changed metabolic pathways affected by liver-specific autophagy-deficiency (Ammonia Recycling, Malate-Aspartate Shuttle, Homocysteine Degradation, Aspartate Metabolism, Urea Cycle and Glycine and Serine Metabolism). KO: liver-specific Atg5-deficient; OPLS-DA: orthogonal partial least squares discriminant analysis; MetPA: metabolic pathway analysis; MSEA: metabolite set enrichment analysis.


