Figure 1.
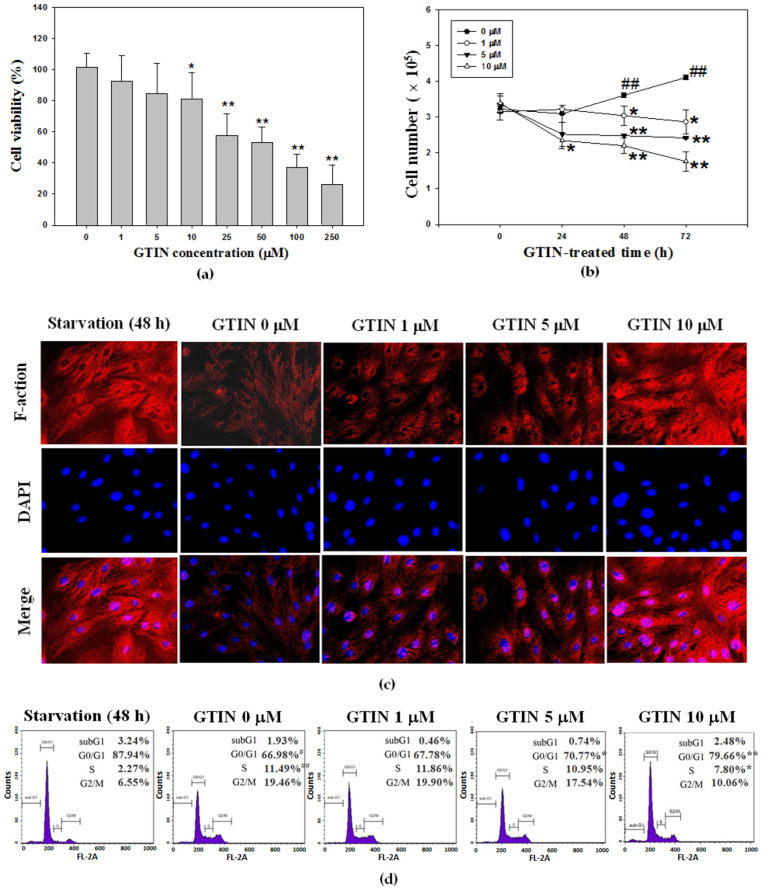
GTIN affected cell viability, proliferation, phenotype switch and cell-cycle progression in VSMCs (a) A7r5 cells were treated with GTIN at various doses (0–250 μM) for 24 h. Cell viability was determined by MTT method. The result was showed as mean ± SD of three repeats from at least three independent experiments. * p < 0.05, ** p < 0.01 compared with the untreated control via one-way ANOVA with Dunnett’s post-hoc analysis. (b) A7r5 cells were treated with GTIN at the indicated doses (1, 5 and 10 μM) for 24, 48 and 72 h. The cell growth curve was analyzed by applying trypan blue exclusion assay. The quantitative result was showed as mean ± SD of three repeats from at least three independent experiments. # p < 0.05, ## p < 0.01 compared with the 0-h untreated control via one-way ANOVA with Dunnett’s post-hoc analysis. * p < 0.05, ** p < 0.01 compared with compared with the respective time point of the untreated control via one-way ANOVA with Dunnett’s post-hoc analysis. (c) A7r5 cells were pre-treated in DMEM supplemented with 0.5% FBS (starvation group) for 48 h, and then incubated with 10% FBS in the absence or presence of indicated doses of GTIN (1, 5 and 10 μM) for additional 48 h. The fixed cells were stained with TRITC-phalloidin (red) to detect F-actin, and counterstained with DAPI (blue) to represent cell nuclei. Representative images of VSMCs morphological alternation were obtained by fluorescence microscopy. (d) Under the same treatment condition, the cell-cycle distribution was assayed by using flow cytometery. The quantitative assessment of the percentage of each cell phase, including subG1, G0/G1, S and G2/M phase, in the cell-cycle distribution was revealed by PI dye. # p < 0.05, ## p < 0.01, compared with the 48-h starvation group via student t-test. * p < 0.05, ** p < 0.01 compared with the untreated control via one-way ANOVA with Dunnett’s post-hoc analysis.

