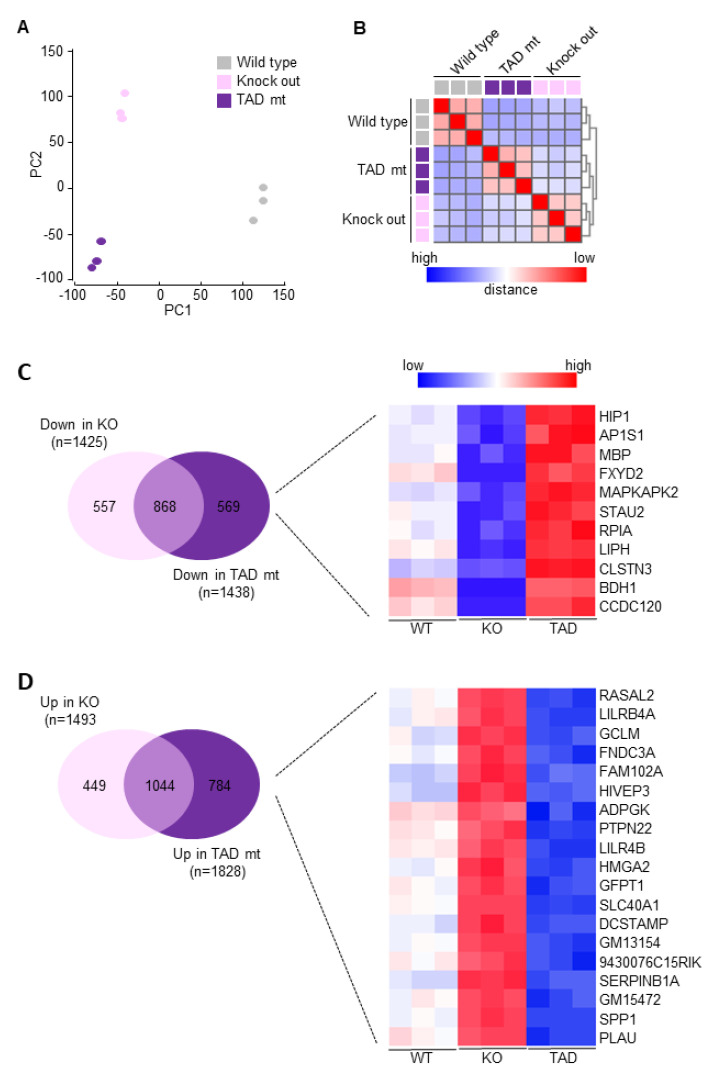
Figure 4.
RNAseq gene expression analysis of wild-type (WT), C/EBPδ knock-out (KO) and C/EBPδ mutant (ΔTAD) macrophages. (A) Principal component analysis of pairwise genetic distances between the different macrophage subtypes. (B) Correlation heat map showing the Euclidean distances between the different macrophage subtypes. (C) Venn diagram showing overlap in downregulation of genes in knock-out and ΔTAD macrophages with a heatmap of genes downregulated in knock-out macrophages but upregulated in ΔTAD macrophages. (D) Venn diagram showing overlap in upregulation of genes in knock-out and ΔTAD macrophages with a heatmap of genes upregulated in knock-out macrophages but downregulated in ΔTAD macrophages. Heatmaps were generated using heatmapper (http://www.heatmapper.ca [39] assessed on 24 November 2020).

