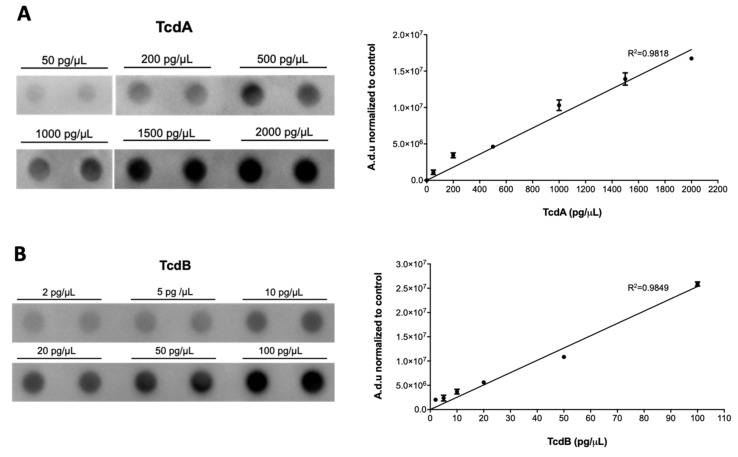
Figure 1.
Representative images and the standard curve of (A) TcdA and (B) TcdB dot plots necessary for determining the concentration of the toxins in the blood of CDI patients. Toxin concentrations are reported as the mean value of triplicate dots ± standard deviation (SD) normalized to control (i.e., 0 pg/mL); a.d.u., arbitrary densitometric unit.

