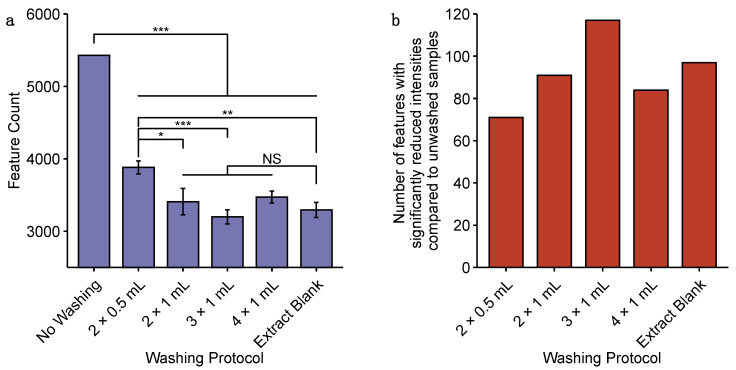
Figure 2.
Evaluation of washing procedures for filtration-based sampling of microtissues. (a) Bar chart showing the total number of features detected in process blanks prepared without washing, or with 2 × 0.5 mL, 2 × 1 mL, 3 × 1 mL or 4 × 1 mL saline washes, followed by 1 × 1 mL water wash. Negative control data were acquired from extraction blanks (i.e., no medium was passed through the cell strainer prior to extraction). Error bars display standard error across 3 replicates. Significant differences between groups (one-way ANOVA with Tukey’s post hoc test) are displayed: *** p < 0.01, ** p < 0.05, * p < 0.1, NS, not significant. (b) Bar chart showing the number of features (of 2023 features detected in ≥2 of 3 replicates in each group) whose intensities are significantly reduced by each washing protocol compared to no washing. Significant reduction in feature intensity is defined where fold change of median intensity in washed samples compared to non-washed samples is <1 and q < 0.1, calculated by one-way ANOVA with Tukey’s post hoc test and FDR correction.

