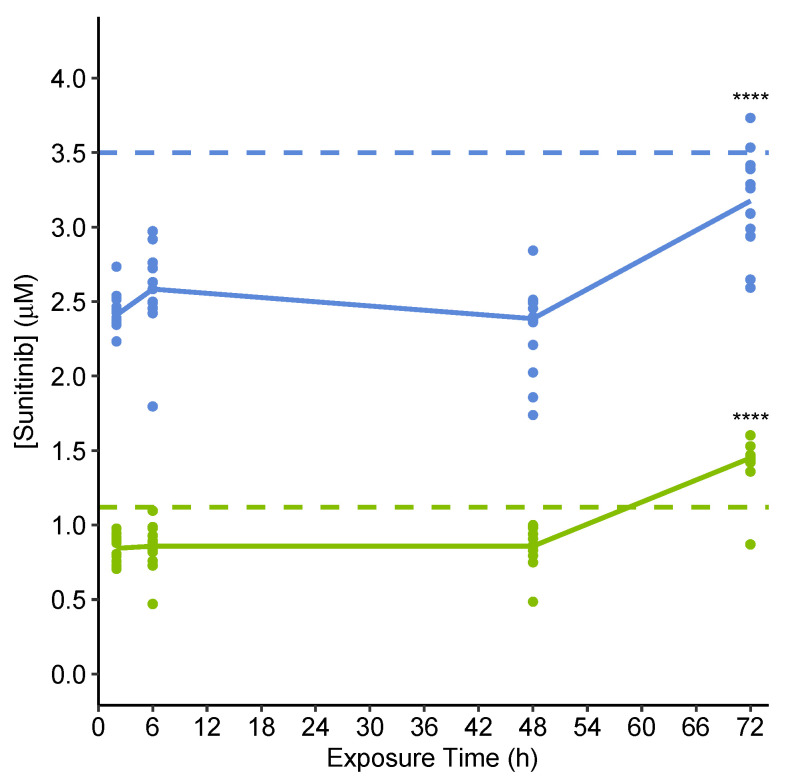
Figure 3.
Absolute sunitinib concentrations in spent media of pooled microtissues collected at 2, 6, 48 and 72 h after initial exposure as calculated from measured peak areas using an external calibration curve. Solid lines show the median extracellular sunitinib concentration at each time point for low (green) and high (blue) exposures separately. Nominal low and high exposure concentrations are displayed as a dashed line, green and blue, respectively. **** p < 0.0001, for comparison of concentrations at 48 h vs. 72 h, per concentration (two-sided t-test). All other comparisons of concentrations at consecutive time points (2 vs. 6 h, 6 vs. 48 h) were not significant (p > 0.05).

