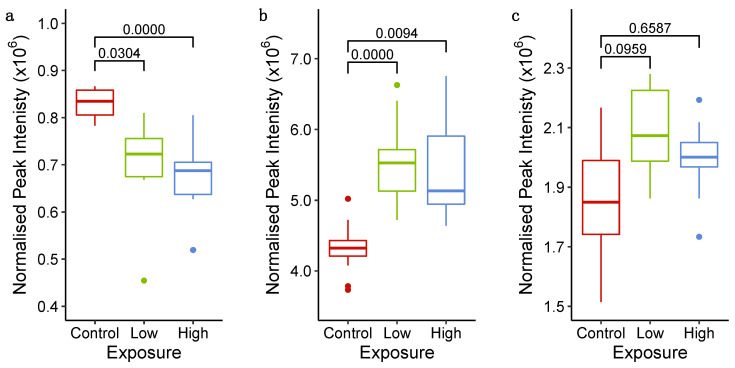
Figure 6.
Peak intensities of (a) hypoxanthine ([2M − H]−), (b) inosine ([M + H]+) and (c) L-glutamine ([M – H − H2O]−) measured using HILIC UHPLC-MS in the spent culture medium of control (exposed to 0.1% DMSO), low (1.1 μM sunitinib) and high (3.5 μM sunitinib) cardiac microtissues at 6 h after exposure. The q-values (one-way ANOVA with Tukey’s honestly significant difference post hoc test and false discovery rate corrected) are displayed.

