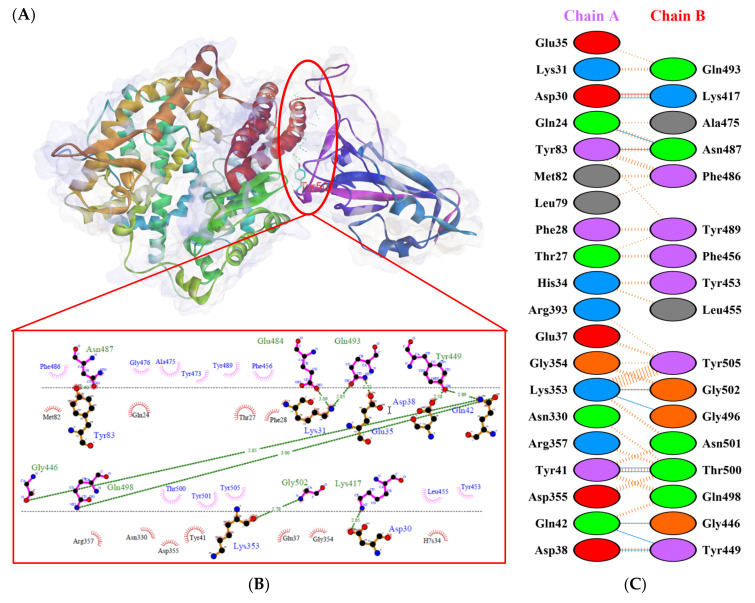
Figure 7.
Protein–protein docking representation of hACE2 and RBD Alpha complexes. (A) The complex’s binding interface; (B) The amino acid’s binding interaction; and (C) The interaction representation, which includes hydrogen ( ), salt bridges (
 ), and non-bonded (
 ) interactions. Chain A represents hACE2 and chain B represents RBD Alpha. Residue colors: positive (blue): H,K,R; negative (red): D,E; neutral (green): S,T,N,Q; aliphatic (grey): A,V,L,I,M; aromatic (purple): F,Y,W; Pro & Gly (orange): P,G.

