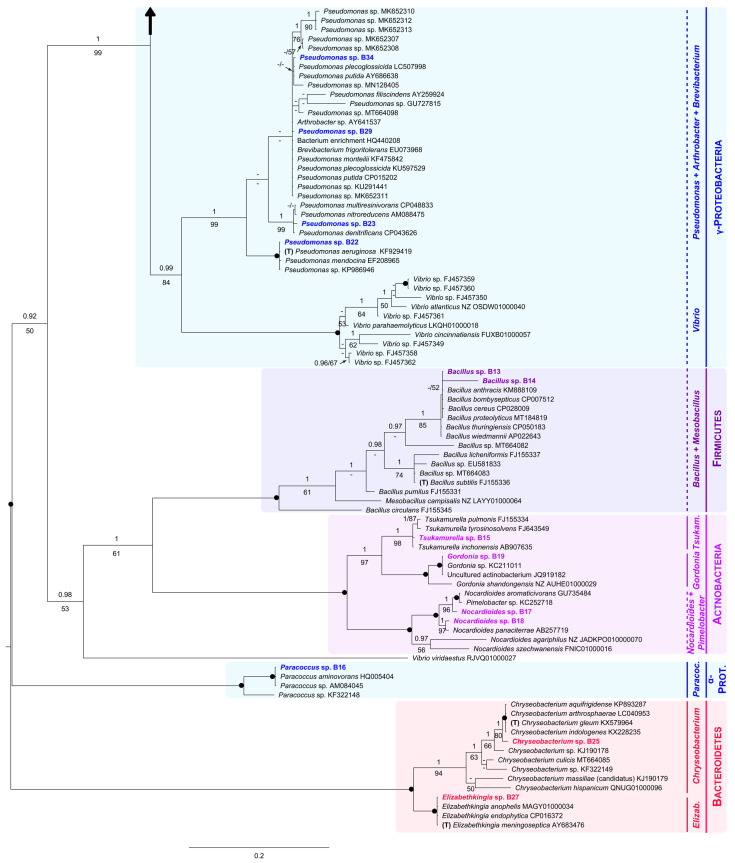
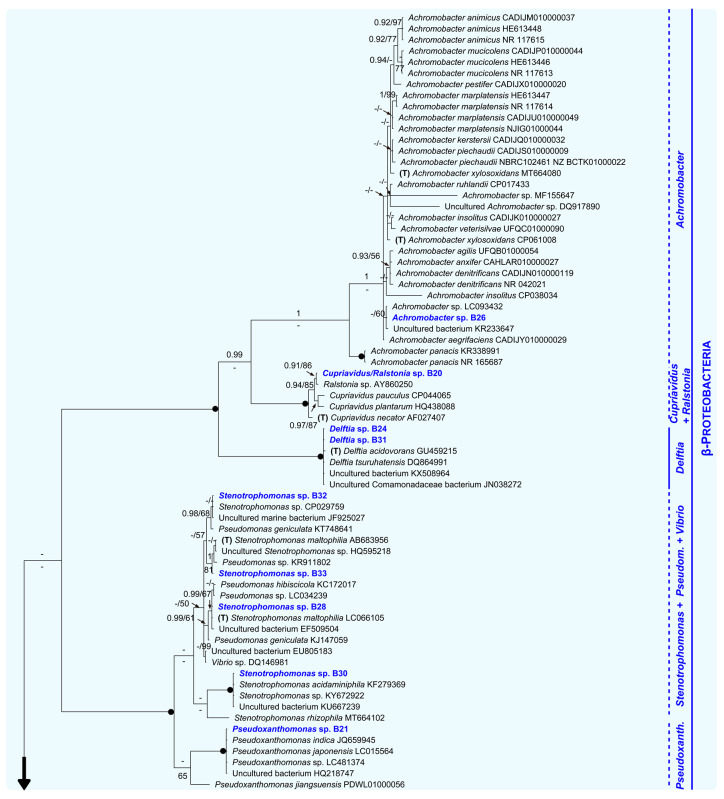
Figure 3.
Unrooted Bayesian tree of the bacteria isolated from eggshells of P. unifilis, and allies. For each isolate, the species name is followed by the GenBank accession number. Sequences obtained in this study are in bold. Specimens representing the type of a genus are marked with a “T”. Numbers above and below the branches correspond to Bayesian posterior probability (PP) and maximum likelihood bootstrap values (BS), respectively (shown if PP ≥ 0.90 and BS ≥ 50%). Black solid dots indicate full support in both analyses. The scale bar represents the average number of substitutions per site. Discontinuous vertical lines indicate either unsupported or non-monophyletic genera. Vertical lines correspond to well-supported monophyletic genera. A large vertical black arrow indicates that the tree continues along the corresponding branch.


