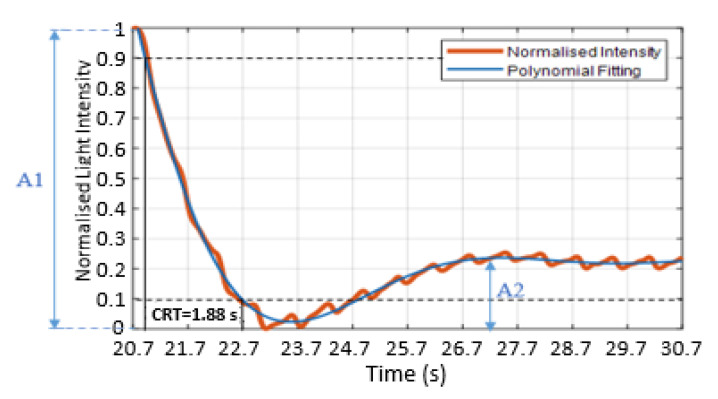
Figure 7.
Normalised refilling signals (orange trace) with the polynomial curve fitting (blue trace). Estimating the CRT used the maximum and minimum thresholds method. The maximum threshold is 0.9 (black dashed line), and the minimum threshold is 0.1 (black dashed line). The CRT is the calculated time of the refilling signal between 0.9 and 0.1. A1 is the amplitude of the blanching intensity relative to the starting intensity, and A2 is the amplitude of the minimum intensity to the next local maximum.

