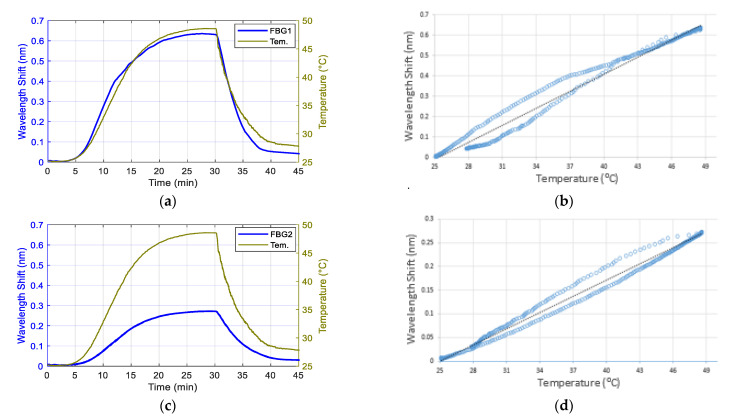
Figure 8.
The temperature responses of FBG1 (a) and FBG2 (c) sensors within the epoxy layer; the green traces show the temperature changes measured with a thermocouple and the blue trace presents the wavelength shift peak of FBGs. (b) and (d) are the hysteresis diagrams of the wavelength shift of FBG1 (b) and FBG2 (d) against variable temperatures.

