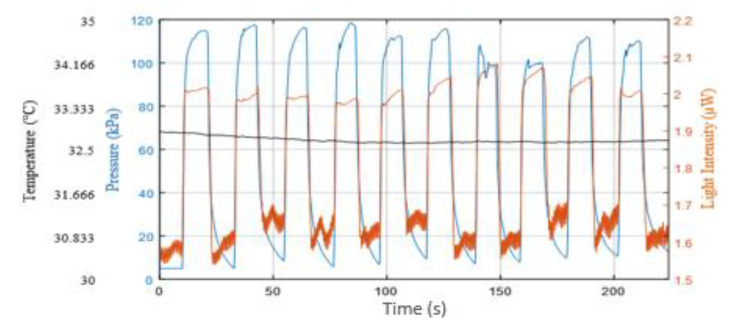
Figure 12.
Applied pressure (blue trace), reflected light intensity changes (orange trace) and underfoot temperature (black trace) of one participant. The data were recorded from the contact pressure sensor, the PPG (light intensity) and data logger, respectively. Application and release of pressure was repeated ten times.

