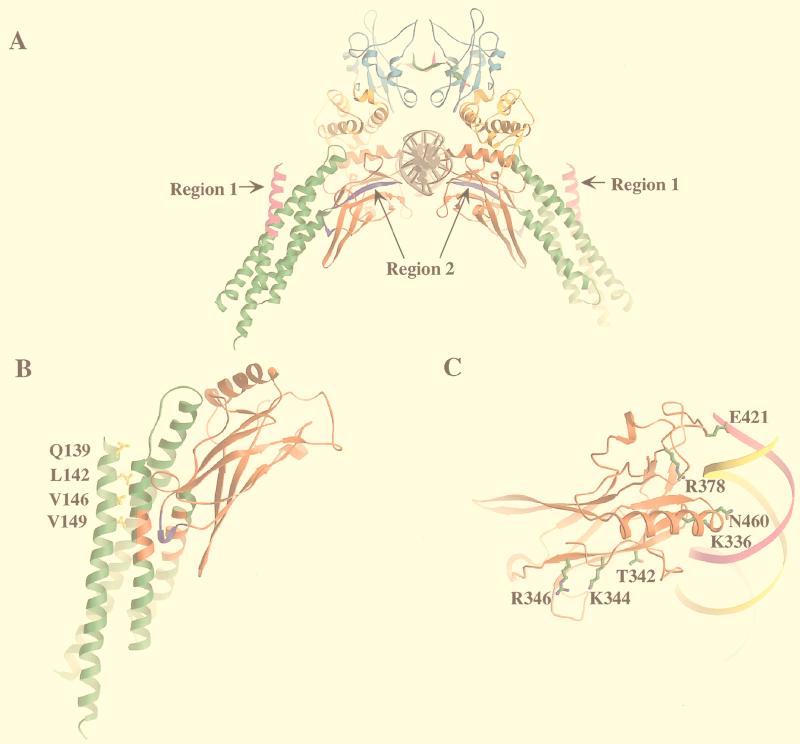
FIG. 5.
Ribbon diagrams of regions 1 and 2, where site-directed mutagenesis was performed, and the corresponding mutated residues in the Stat1 molecule. (A) Two c-Jun-interactive regions in Stat3 are shown in a ribbon diagram of the Stat1 core dimer on DNA. Region 1 is shown in magenta, and region 2 is shown in purple. The coiled-coil domain is shown in green, the DNA binding domain is in red, the linker domain is in orange, and the SH2 domain is in cyan. The tail segments are shown in green and in magenta. (B) Four corresponding mutated residues in region 1 of Stat3 are shown in a ribbon diagram of the coiled-coil domain (green) and DNA binding domain (red) of the Stat1 monomer. M135 in Stat1, the residue corresponding to V137 in Stat3, is not included in the ribbon diagram. (C) Three corresponding mutated residues in region 2 of Stat3 are shown in a ribbon diagram of the DNA binding domain of the Stat1 monomer with DNA.

