Figure 2.
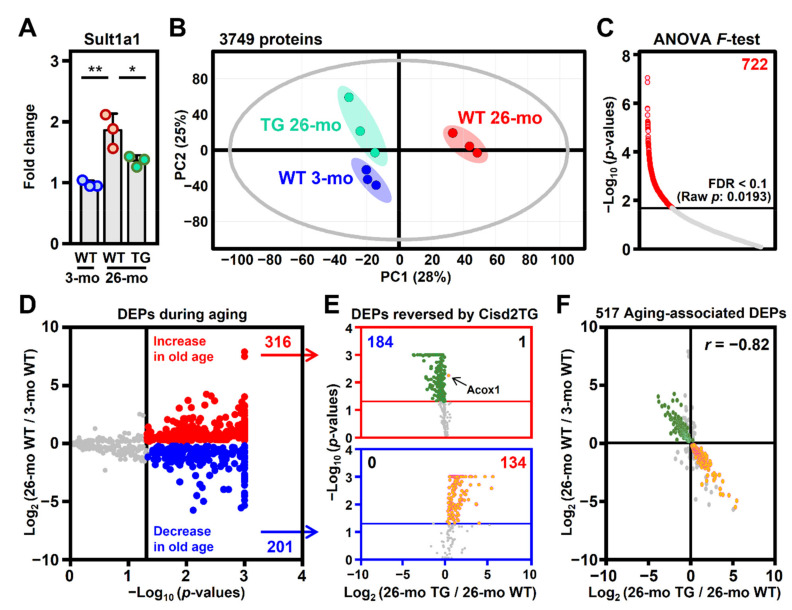
A youthful pattern of the liver proteome was maintained in the Cisd2 transgenic mice. (A) Levels of the Sult1a1 protein as a positive control for liver aging in the 3-mo WT, 26-mo WT and 26-mo Cisd2TG mice (n = 3 in each group); * p < 0.05; ** p < 0.01 (Tukey’s HSD test after the one-way ANOVA had reached statistical significance). (B) Principal component analysis (PCA) of the liver proteomes of the mice forming the three groups. (C) Differentially expressed proteins (DEPs) identified using the one-way ANOVA F-test, with the overall false discovery rate (FDR) controlled to be less than 10%. (D) Volcano plots showing selected aging-associated DEPs based on their p-values from Tukey’s HSD test after conducting the one-way ANOVA F-test. The vertical line denotes the significance threshold cutoff (p-value < 0.05). The proteins that passed this criterion are shown in either red (increased) or blue (decreased). (E) The DEPs reversed by Cisd2TG are identified among the 517 aging-associated DEPs based on the p-value of Tukey’s HSD test. The upper red box contains the 316 upregulated DEPs associated with aging, whereas the lower blue box contains the 201 downregulated DEPs associated with aging. The horizontal lines denote the significance threshold cutoff (p-value < 0.05). The proteins that had their changes in expression level reversed in the Cisd2TG mice are shown in either orange (increased in the Cisd2TG mice) or green (decreased in the Cisd2TG mice). (F) Pearson correlation analysis of the 517 aging-associated DEPs. The colored dots are the 319 aging-associated DEPs reversed in the Cisd2TG mice (184 aging up TG down; 134 aging down TG up).

