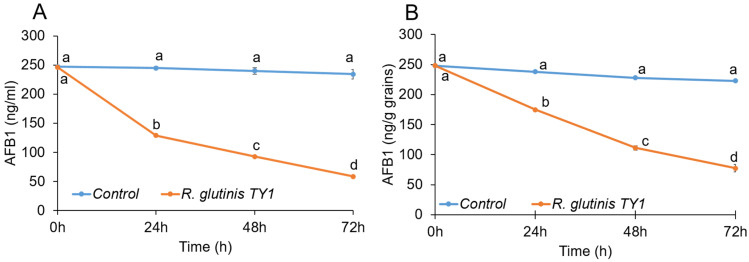
Figure 8.
Effect of R. glutinis TY1 strain on AFB1 degradation in PDB medium (A) and wheat grains (B). The time course of AFB1 degradation was monitored by HPLC. Error bars represent the standard error of the mean (SEM) across three independent replicates. One-way ANCOVA was conducted to determine a statistically significant difference between treatment and control on mycotoxin concentration controlling for time (covariance). Time significantly differed in its effect on treatment and control (p < 0.0001). Testing for each time point using ANOVA is an evident that only time zero does not differ between control and treatment. Different letters above the error bars indicate statistically significant differences at p < 0.05, as determined using the Duncan’s multiple range test.

