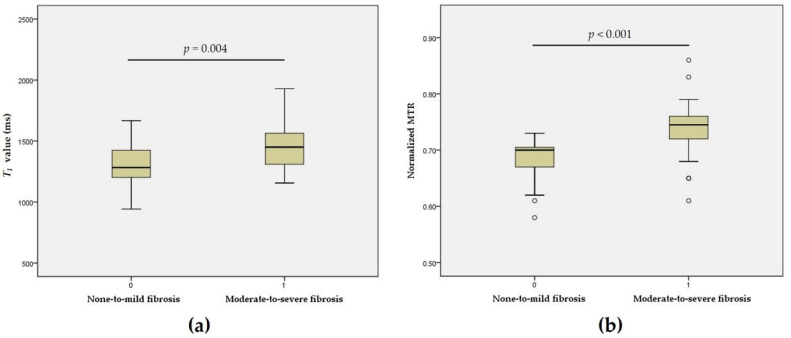
Figure 2.
Boxplots showing differences in the T1 value and normalized MTR between none-to-mild and moderate-to-severe fibrosis. Significant differences in T1 values (t = −3.066, p = 0.004) (a) and normalized MTR (z = 5.081, p < 0.001) (b) were found between the none-to-mild and moderate-to-severe fibrosis groups. MTR = magnetization transfer ratio; T1 = longitudinal relaxation time.

