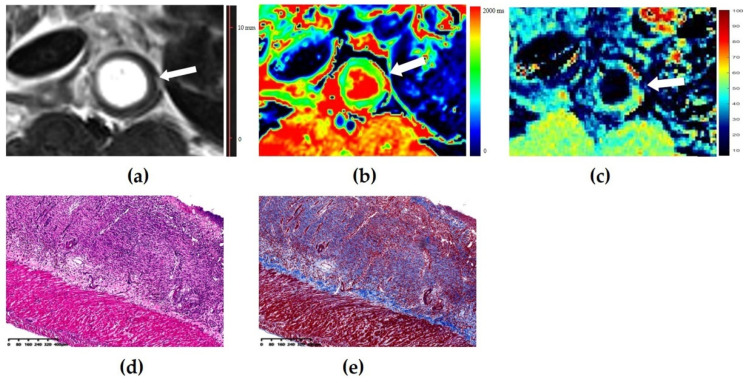
Figure 5.
Images of a severely fibrotic and severely inflammatory bowel wall of rat. (a) Axial T2-weigheted imaging reveals a markedly thickened bowel wall. (b) The T1 map shows that the T1 value is 1549 ms (higher than the cutoff value of 1266 ms), thus indicating the presence of moderate-to-severe fibrosis. (c) The normalized magnetization transfer ratio (MTR) of the corresponding bowel wall is 0.83 (higher than the cutoff value of 0.72), which suggests the presence of a moderate-to-severe fibrosis. (d) Hematoxylin and eosin (magnification = 4.92) and (e) Masson’s trichrome staining (magnification = 4.96) depicts severe inflammation (score = 3) and severe fibrosis (score = 3). In this case, the diagnosis performance of the T1 value is equal to that of normalized MTR.

