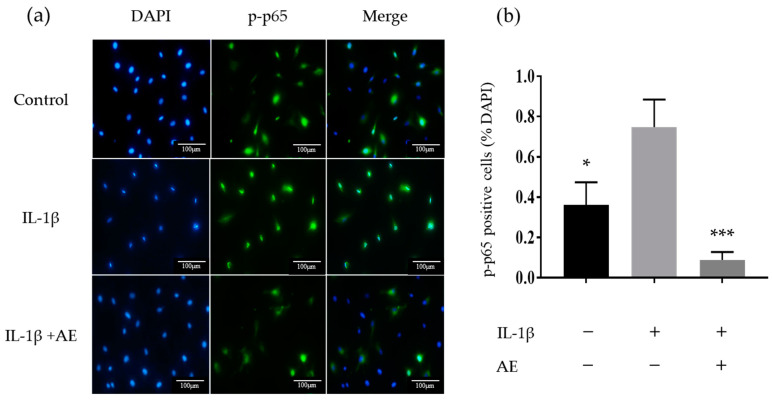
Figure 3.
Immunocytochemistry of p-p65 expression. (a) Representative image showing the localization of p-p65 in chondrocytes. Original magnification ×200. (b) Percentages of p-p65 positive cells relative to total cell numbers. Data are shown as the mean ± SD of five fields. Statistical significance: Tukey’s multiple comparisons test * p < 0.05, *** p < 0.001 relative to the result of IL-1 βstimulation without AE.

