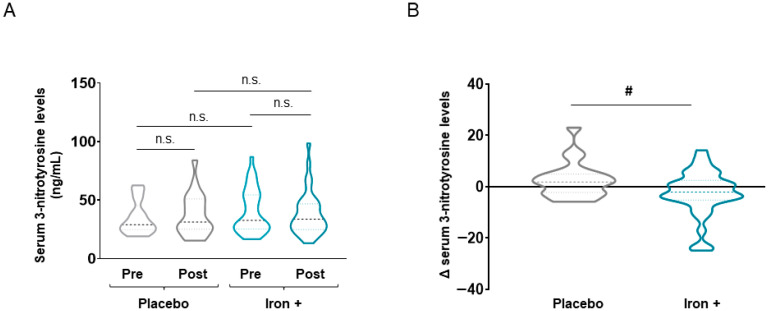
Figure 3.
Violin plots of absolute 3-nitrotyrosine levels in serum of all COPD patient groups (A) and delta (post-pre) of serum 3-nitrotyrosine levels in placebo and iron-treated groups (B). The dashed line represents the median and the dotted lines the interquartile ranges. Statistical significance: n.s., no significance; # p < 0.05 between iron and placebo treatment.

