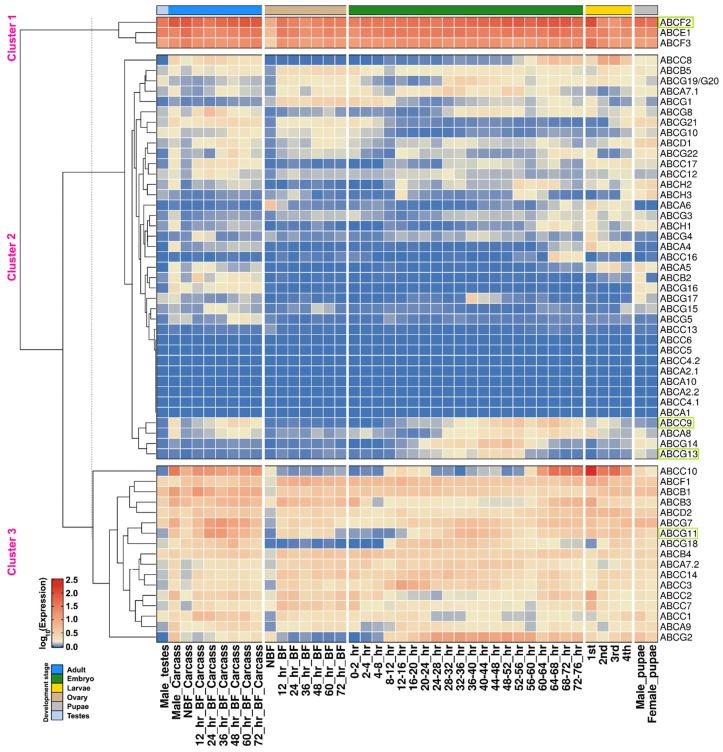
Figure 3.
Expression profiling of Ae. aegypti ABC transporter transcripts in different developmental stages as well as at different time points after the blood-feeding using K-means clustering [45]. The Color scheme indicates the log10 FPKM expression value. NBF, non-blood-fed females; BF, blood-fed females; 1st to 4th instar stages of larvae. The expression pattern of few genes validated by qPCR is marked in boxes.

