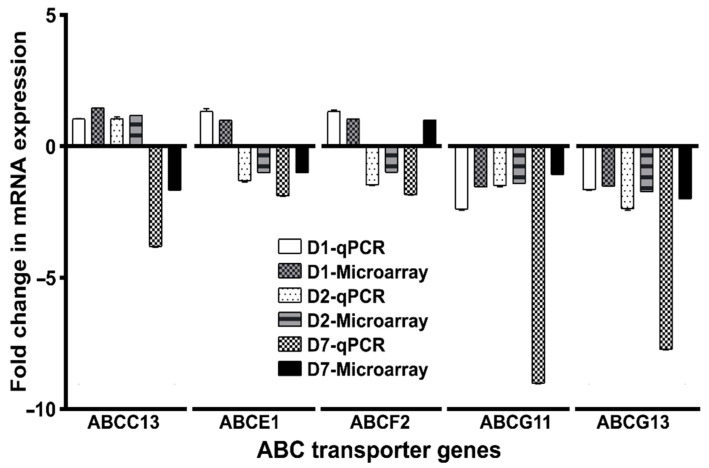
Figure 6.
Comparative analysis of the microarray and qPCR expression data of a few representative ABC transporter genes (as mentioned on the x-axis) during DENV2 infection. The fold change in mRNA expression was calculated by ΔΔCt method as described in Materials and Methods, using the actin gene as an internal control. All samples were collected from three biological replicates of each treatment (DENV2 infected blood— v/s uninfected blood-fed) at specified time intervals. Error bars indicate mean ± SD (n = 3). D1, D2 and D7 indicate the days post-viral infection. The sequence of the primers used in qPCR is given in Supplementary Table S1.

