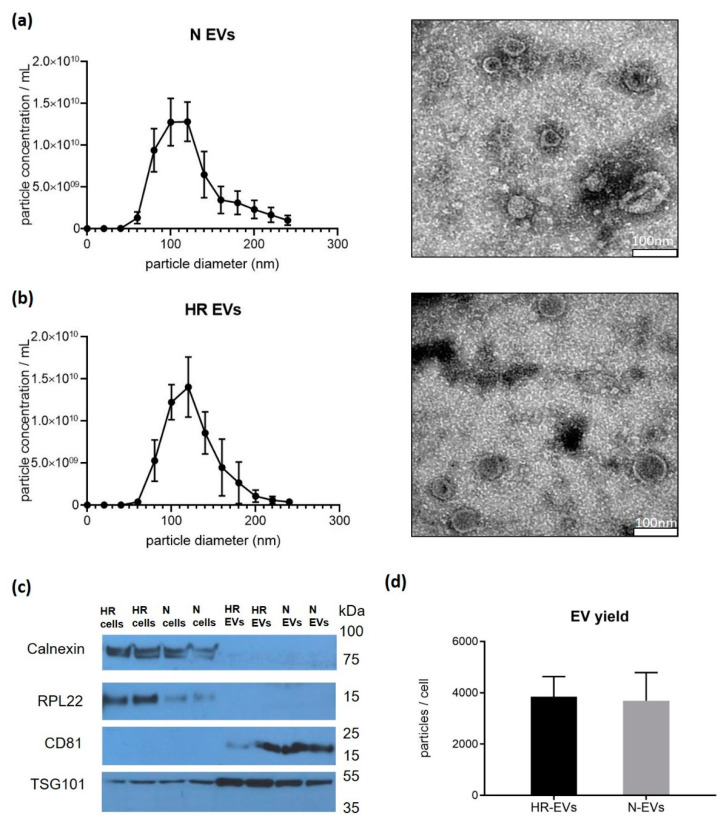
Figure 1.
Characterization of EVs secreted from normoxic cultured (N) and cyclic hypoxia-reoxygenation treated (HR) C2C12 cells. Size distribution using nanoparticle tracking analysis (NTA) and transmission electron microscopy (TEM) of (a) N EVs and (b) HR EVs. NTA data is presented as the mean ± SD (n = 5). Scale bar of EM image: 100 nm. (c) Characterization of Calnexin, RPL22, CD81, and TSG101 using Western blot. Full-length blot is presented in Supplementary Figure S7. (d) Yield comparison of HR EVs and N EVs. Data is presented as the mean ± SD (n = 3).

