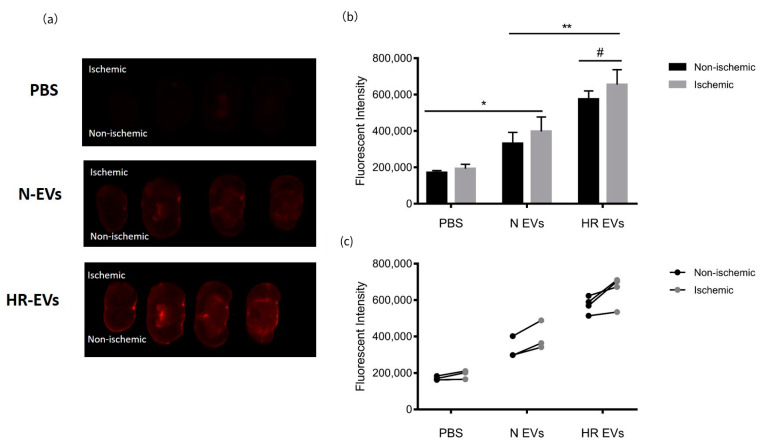
Figure 6.
Distribution of myoblast EVs in ischemic brains. (a) Fluorescent images of brain sections from stroke mice injected with PBS, N EVs, and HR EVs, respectively. Ischemic hemispheres are the top hemispheres (left-side) for all the images. (b) Quantification of fluorescent intensities in both hemispheres by Fiji ImageJ. The data is presented as the mean ± SD; n = 3 in PBS and N EVs group, n = 4 in HR EV group. Two-way ANOVA with multiple comparisons, * adj p-value < 0.05, ** adj p-value < 0.01, # adj p-value < 0.05 (non-ischemic vs ischemic in the HR EV-treated group). (c) Individual values of fluorescent intensities in both hemispheres.

