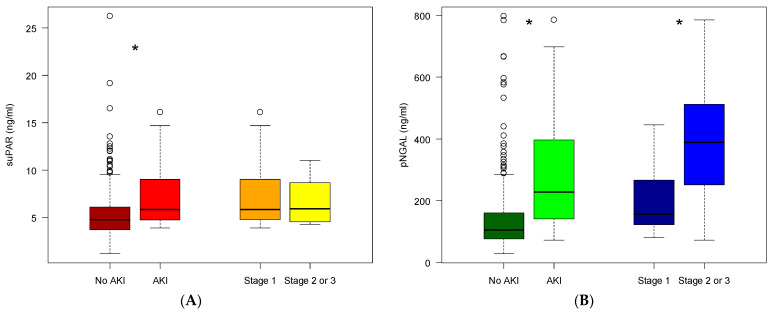
Figure 1.
Plasma concentration of suPAR and NGAL at inclusion. (A) suPAR values in patients: without AKI (brown), developed AKI (red) within 48 h after inclusion, developed AKI stage 1 (orange), developed AKI stage ≥2 (yellow). (B) NGAL values in patients: without AKI (dark green), developed AKI (light green) within 48 h after inclusion, developed AKI stage 1 (dark blue), developed AKI stage ≥2 (light blue). The horizontal lines show minimum and maximum values of calculated non-outlier values; open circles indicate outlier values (* p < 0.05).

