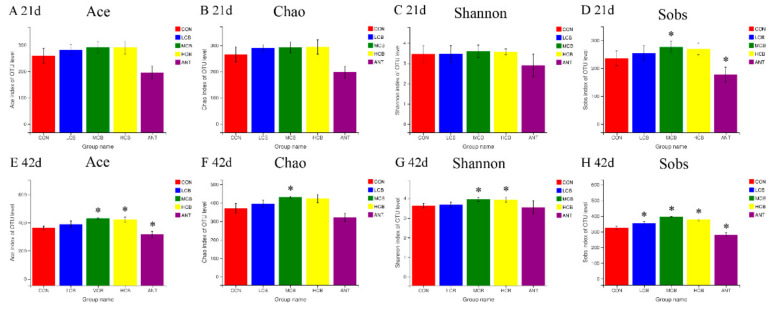
Figure 6.
Estimators of α-diversity indices in ceca of Pekin ducks in the five groups at different timepoint. (A), Ace index at 21 d; (B), Chao index at 21 d; (C), Shannon index at 21 d; (D), Sobs index at 42 d; (E), Ace index at 42 d; (F), Chao index at 42 d; (G), Shannon index at 42 d; (H), Sobs index at 42 d. The superscript * indicates that there are significant differences (p < 0.05) compared with the control group. CON, group Con; LCB, group CB200; MCB, group CB400; HCB, group CB600; ANT, group A150.

