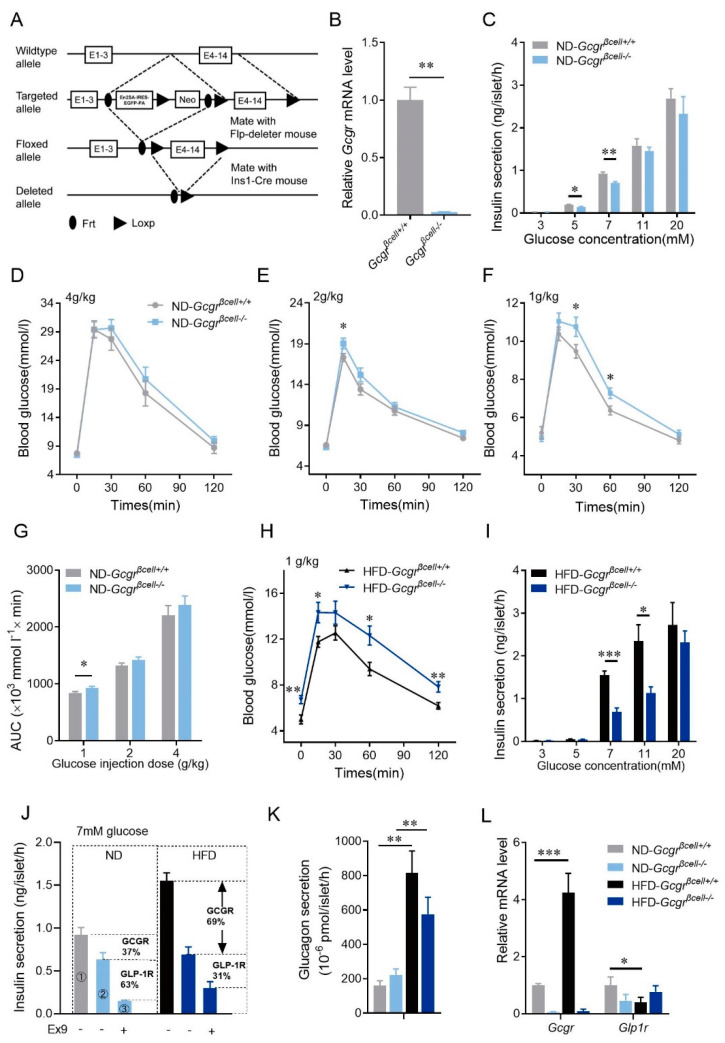
Figure 3.
The physiological function of β-cell GCGR becomes upregulated and essential to glucose homeostasis in mice fed high-fat diets (HFD). (A) Schematic depicting the strategy for generating β-cell GCGR knockout mice. (B) Knockout efficiency of Gcgr mRNA in Gcgrβcell−/− mouse islets. (C) Insulin secretion of isolated islets from Gcgrβcell+/+ and Gcgrβcell−/− mice fed the normal diet (ND) at different glucose concentrations (3 mM, 5 mM, 7 mM, 11 mM and 20 mM) (n = 5–9 per condition). (D–F) Intraperitoneal glucose tolerance tests (IPGTTs) on Gcgrβcell+/+ and Gcgrβcell−/− mice fed the ND injected with different doses of glucose. The glucose doses were 4 g/kg (D), 2 g/kg (E), and 1 g/kg (F) (n = 12–14 mice per condition). (G) The areas under the curves (AUCs) of the intraperitoneal glucose tolerance tests (IPGTTs) on Gcgrβcell+/+ and Gcgrβcell−/− mice fed the ND injected with different doses of glucose (1 g/kg, 2 g/kg, and 4 g/kg) (n = 12–14 mice per condition). (H) IPGTTs on Gcgrβcell+/+ and Gcgrβcell−/− mice fed the HFD injected with 1 g/kg glucose (n = 12–15 mice per condition). (I) Insulin secretion of isolated islets from Gcgrβcell+/+ and Gcgrβcell−/− mice fed the HFD at different glucose concentrations (3 mM, 5 mM, 7 mM, 11 mM and 20 mM) (n = 5–9 per condition). (J) Contributions of GCGR and GLP-1R on insulin secretion of isolated islets from Gcgrβcell+/+ and Gcgrβcell−/− mice fed the ND or HFD in 7 mM glucose (n = 6–7 per condition). The proportions of GCGR and GLP-1R contributions are calculated as follows. The enhanced insulin secretion by glucagon is via activation of both GCGR and GLP-1R. Therefore, in mice fed the ND, the total amount of enhanced insulin secretion by glucagon equals the difference of insulin secretion between Gcgrβcell+/+ islets and Gcgrβcell−/− islets pretreated with Exendin 9-39 (①−③). In this regard, the contribution of GCGR and GLP-1R were 37% ((①−②)/(①−③)) and 63% ((②−③)/(①−③)), respectively. The same method was applied on mice fed the HFD. (K) Glucagon secretion from isolated islets of Gcgrβcell+/+ and Gcgrβcell-/- mice fed the ND or HFD under stimulation with 7 mM glucose (n = 4 per condition). (L) Relative mRNA levels of Gcgr, Glp1r in islets from Gcgrβcell+/+ and Gcgrβcell−/− mice fed the ND or HFD (n = 3–4 per condition). Statistical significance was evaluated using Student’s t-test for single Gaussian-distributed datasets or the Mann–Whitney rank-sum test for non-single Gaussian-distributed datasets. * p < 0.05, ** p < 0.01, *** p < 0.001.

