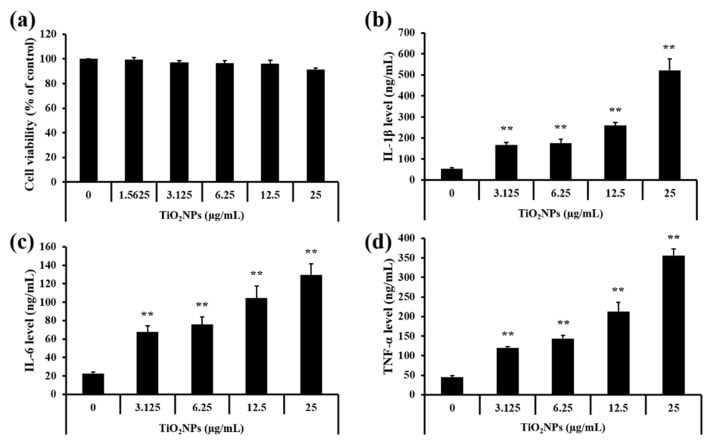
Figure 7.
Effects of TiO2NP treatment on cell viability and inflammatory cytokines in NCI–H292 cells. (a) Cell viability. (b) IL-1β level. (c) IL-6 level. (d) TNF-α level. Control, PBS treatment; 1.5625, 3.125, 6.25, 12.5, and 25 μg/mL of TiO2NP treatment; respectively. Data are represented as means ± SD, n = 3. ** p < 0.01, significantly different from the control group.

