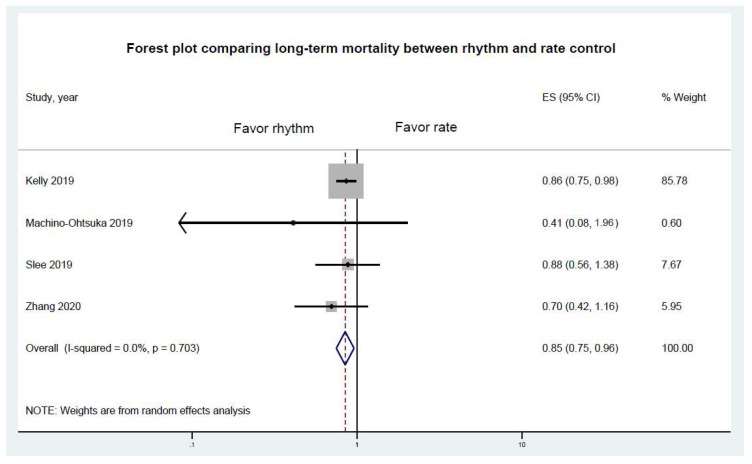
Figure 2.
Forest plot comparing risk of long-term mortality between rhythm and rate controls. Horizontal lines represent the 95% Cis, with marker size reflecting the statistical weight of the study, using the random-effects model. A diamond data marker represents the overall adjusted OR and 95% CI for the outcome of interest.

