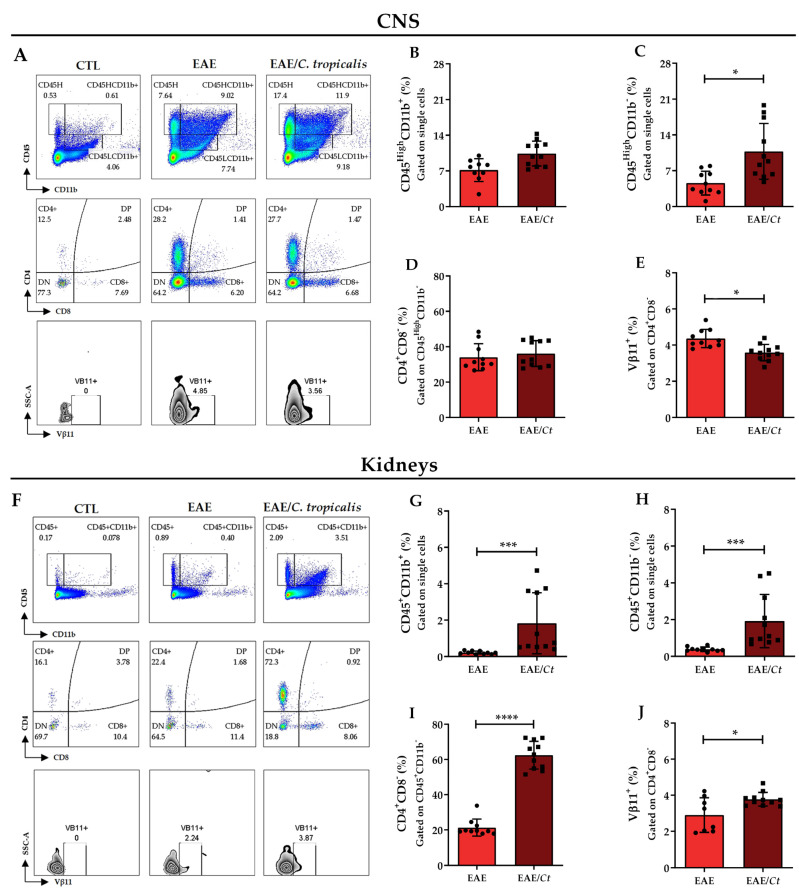
Figure 9.
Leukocyte subpopulations in the CNS and kidneys of EAE and EAE/Ct mice. Female C57BL/6 mice were infected with 1 × 10⁶ viable C. tropicalis yeasts three days before EAE induction and evaluated for the percentage of myeloid cells (CD45HighCD11b+), other immune cells (CD45HighCD11b−), CD4+ cells (CD4+CD8−), and TCR expression (Vβ11+) in the CNS (A–E) and kidneys (F–J) on the 16th day after EAE induction. Representative flow cytometric plots for leukocyte populations in the CNS (A) and kidneys (F). The results are expressed as mean ± SD; n = 10–11/group; two independent experiments; * p < 0.05; *** p < 0.005, and **** p < 0.001.

