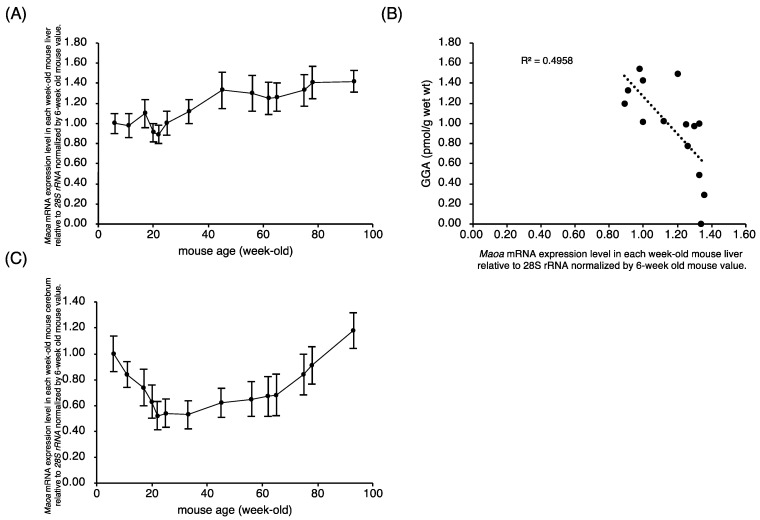
Figure 3.
Apparent inverse correlation of hepatic Maoa mRNA levels and hepatic GGA content in C3H/HeN mice. (A) The relative expression levels of Maoa mRNA in each week-old mouse liver to 6-week-old mouse liver. (B) Correlation between the amount of endogenous GGA and hepatic expression level of Maoa mRNA. Each point represents the average value of each age group (n = 5). (C) The relative expression levels of Maoa mRNA to 6-week-old mouse cerebrum in each week-old mouse cerebrum. All points represent the mean ± SEM (n = 5). GGA, geranylgeranoic acid; Maoa, monoamine oxidase A.

