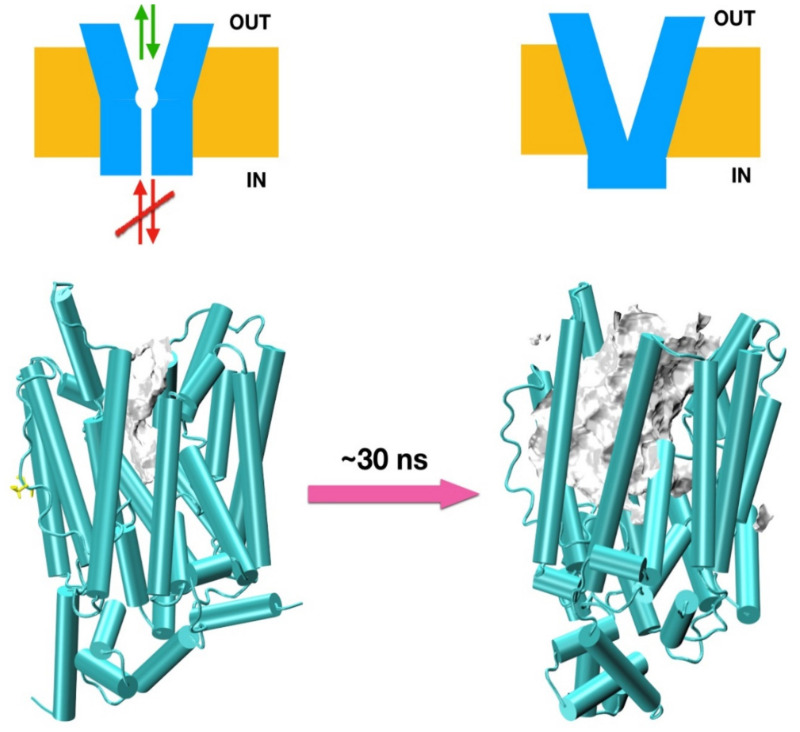
Figure 3.
Effects of the R351W mutation of SLC2A9b. Top: schematic representation of the channel (in blue), membrane (yellow), and flow (arrows). Bottom: snapshots of the R351W model during an MD trajectory in cartoon representation in green. Internal space is represented by showing the solvent accessible surface in gray (compared to similar surfaces describing the vestibular areas in Figure 2). The initial model structure is surprisingly stable, but it deforms under molecular dynamics simulations, as seen in the snapshot on the right after ~30 ns of MD trajectory. Notice the very substantial reorganization of the internal helices.

