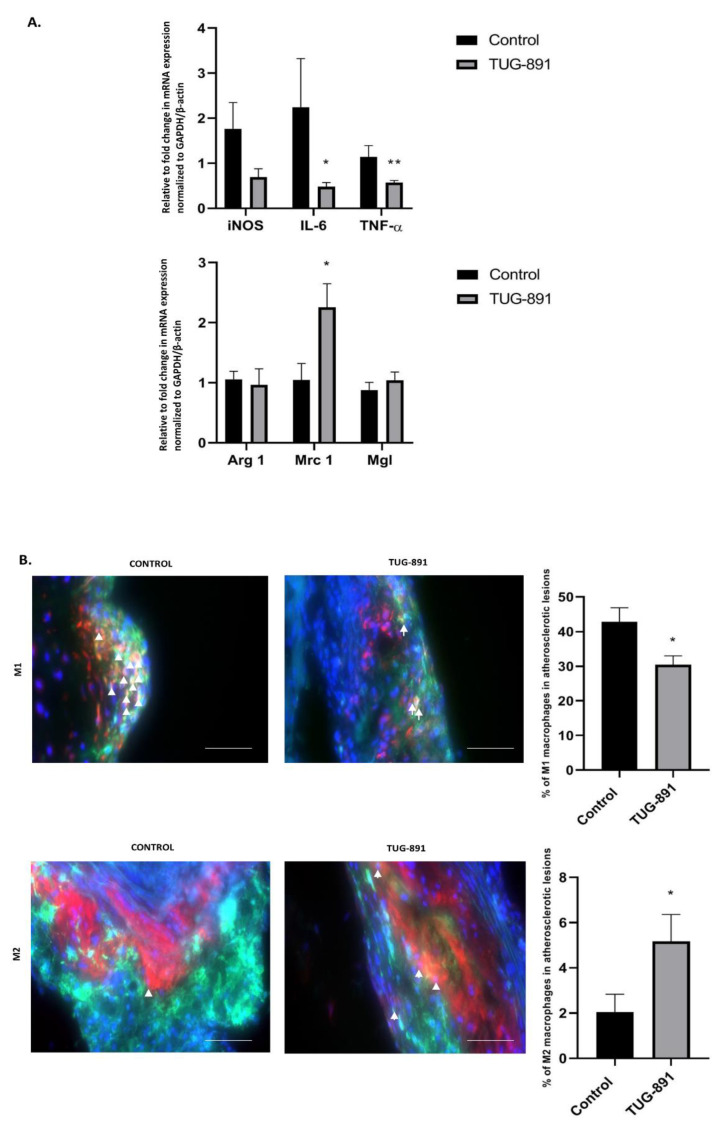
Figure 2.
Macrophage phenotyping in atherosclerotic plaque. Validation of macrophages morphometry by RT-PCR analysis confirmed a trend toward reduction of M1 markers and no significant increase in M2 genes in the aorta of GW9508-treated apoE−/− mice, (A) (* p < 0.05; ** p < 0.005; n = 6–8 per group). Representative micrographs showing immunohistochemical staining of aortic roots from control and TUG-891-treated apoE-knockout mice. F4/80 (green), nitric oxide synthase 2 (iNOS)/arginase 1 (red) and 4′,6-diamidino-2-phenylindole (DAPI) (blue), confirming the respective macrophage phenotype (white arrows). Adjacent graphs represent mean ± SEM values, (B) (* p < 0.05; n = 5–7 per group).

