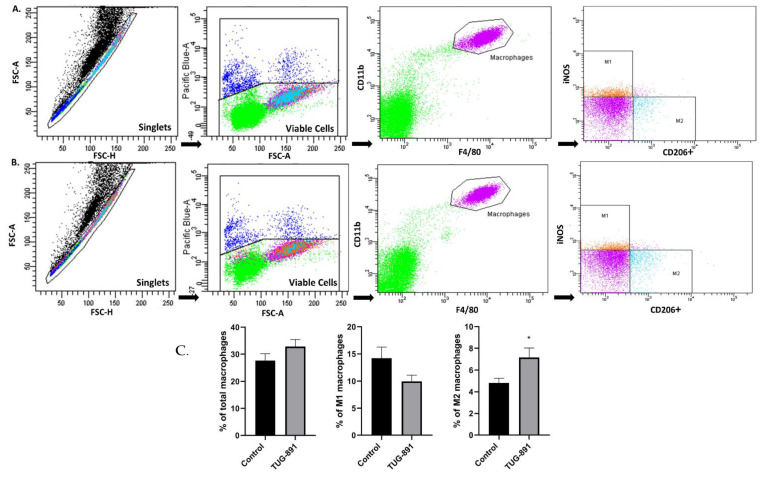
Figure 3.
Macrophage phenotyping in peritoneal tissue. Representative flow cytometry histograms in peritoneal tissue from control and TUG-891-treated apoE-knockout mice. F4/80 and CD11b+ (A), F4/80, iNOS; CD11b+; F4/80 (B), CD206+; CD11b+; F4/80 (C). Adjacent graphs represent mean ± SEM values, (* p < 0.05; n = 10–14 per group).

