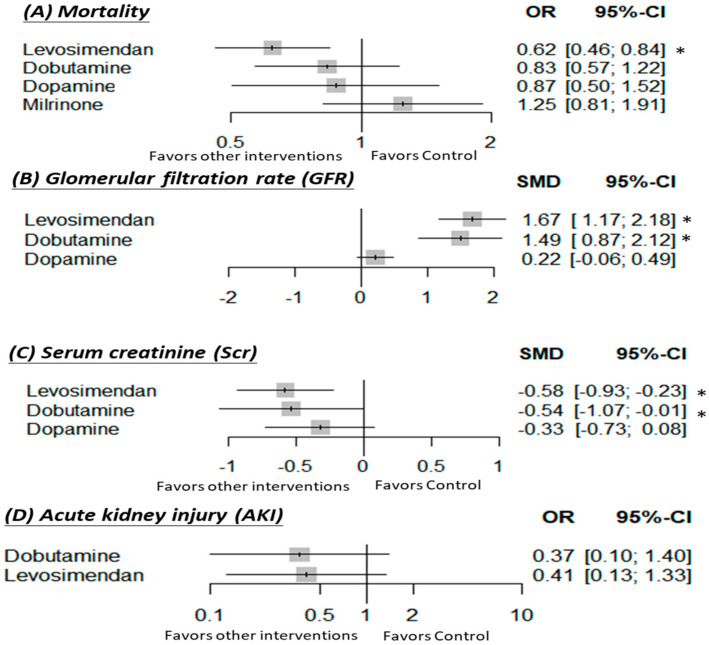
Figure 2.
Forest plots of the overall network meta-analysis. Interventions were compared with the control for (A) mortality, (B) GFR, (C) Scr, and (D) AKI. CI: Confidence interval; OR: Odds ratio; SMD: Standardized mean difference. The control group was defined as a non-active treatment including an additional diuretic regimen or placebo. * Significant results.

